




Search 12,100+ Infographics!
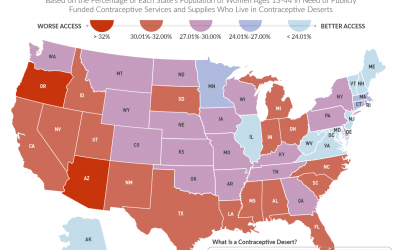
States With The Best And Worst Birth Control Access Across America
There are approximately 19 million women in the U.S. who live in contraceptive deserts, or areas without reasonable access to a full range of birth control options. Some women may have to travel long distances and take time off work in order to obtain birth control. The following infographic from YourLawyer.com analyzes which U.S. states offer the best and worst access to birth control across the county.

How Did Education Change During the Pandemic?
Almost monthly, UNESCO, in particular the Bureau of Education, publishes reports on the threats to the education sector through the coronavirus. One of the statements said that due to the disrupted educational process for millions of pupils and students, the world is threatened with degradation, as the level of education of the population will significantly decrease. The following infographic explores how education changed during the Coronavirus pandemic.

50 Iconic Vehicles From Video Games
Video games are a showcase of creativity, innovation, and determination. Exploring the transportation that game designers have created highlights just how visionary video games truly are. This infographic is a collection of video game vehicles from games that span decades. There are spaceships, cars, stagecoaches, flying machines, mech suits, horses, and even giant yellow birds all illustrated to scale.
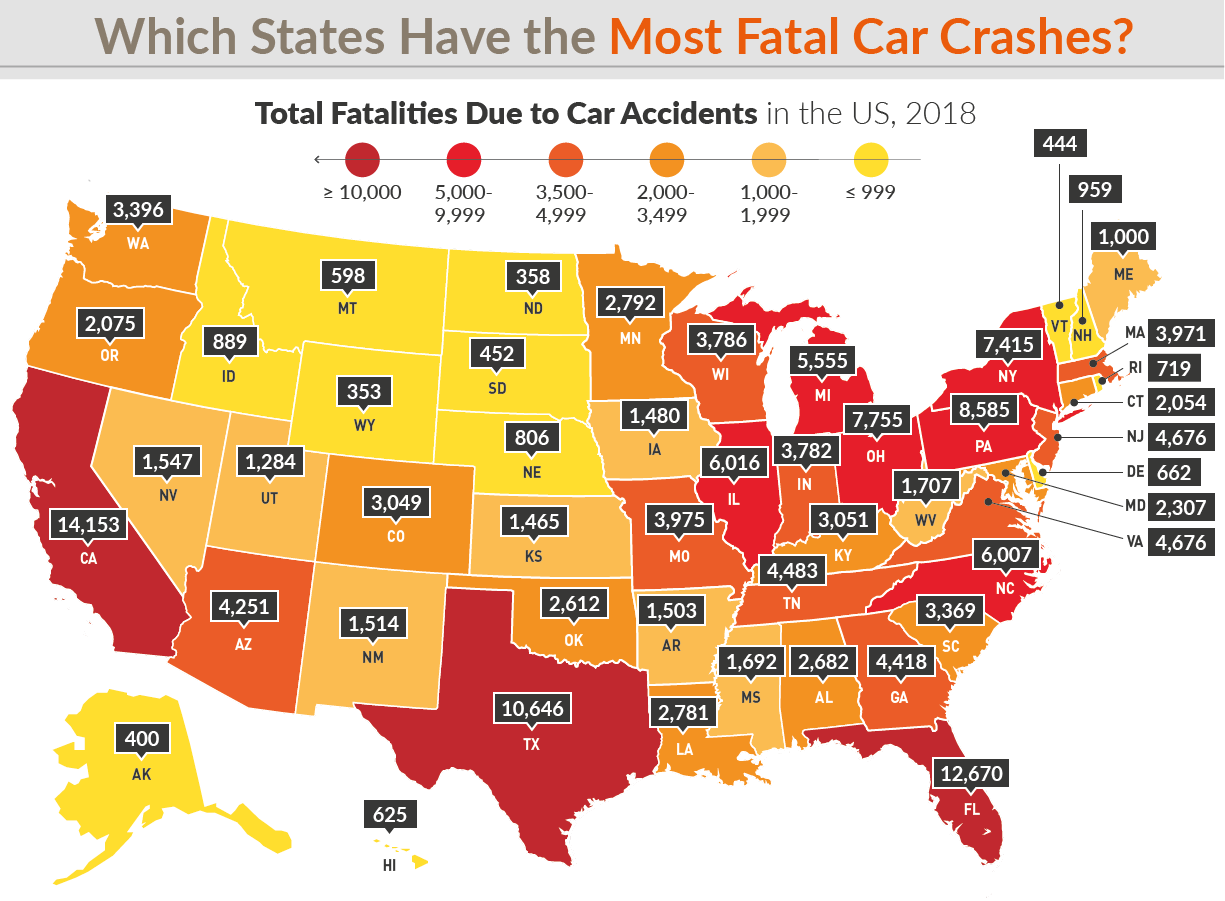
Which States Have the Most Fatal Car Accidents?
Car accidents account for 1.35 million deaths per year around the world. It is the leading cause of death for both children and young people between 5 and 29. Speed related crashes in the United States cost American drivers over 40 billion dollars a year. This map displays the deadliest states in the US for fatal car accidents per 100,000 people.
The State of the SMS Market in 2020 and Beyond
The SMS market is set to explode, with the number of text-capable phone subscriptions worldwide recently surpassing a whopping 5.1 billion. Check out the following infographic to learn more about the growth of the B2B SMS market broken down by industry and use case, consumer insights, and predictions for top future trends in the business messaging space.

Counties With the Most Alcohol-Impaired Driving Deaths in the United States
Each day, an average of 29 people across America lose their lives in car crashes that involve a drunk driver. That’s one death every 50 minutes! In 2016 alone, 28% of all traffic-related deaths in the U.S. were a result of crashes involving alcohol-impaired drivers, amounting to 10,497 lives lost. In this infographic, learn which U.S. counties have the most alcohol-impaired driving deaths.

Face Mask Report Card
Many are getting creative with the face masks they create or purchase during these times, but are they all effective? The following infographic from Sock It To Me Blog details some of the different types of face masks you’re likely to come across. You’ll gain insight into what types of masks are most likely to protect you, your friends, and your family when going out in public.

Implementation of Big Data
One aspect of digital transformation is that organizations struggle to get right is the identifying, capturing, managing and analyzing of big data. Organizations must be strategic in how they approach the collection, management and analysis of their data if they want to find the gems of insight that will provide them with a competitive edge. This infographic covers the different aspects of Big Data like what is it and challenges in managing it and why is it so popular.

Which Gas Detection Device is Right for Your Workplace?
Choosing a gas monitor or detection device depends on the nature of your workplace and how your employees interact with the space. Learn about the pros and cons of different types of gas monitors to make the right choice for your business in this infographic from PKSafety.com.

The 50 Deadliest U.S. Counties For Bicyclists
Electric bikes, scooters, and bicycles are increasing in popularity due to their low environmental impact and cost-saving benefits. They also give people an opportunity to get outside and exercise. As the number of cyclists on the road increases, so do the number of accidents. Unfortunately, these accidents can lead to serious injury or even death. Here is an infographic that looks at the 50 deadliest U.S. counties for bicyclists.
States With The Best And Worst Birth Control Access Across America
There are approximately 19 million women in the U.S. who live in contraceptive deserts, or areas without reasonable access to a full range of birth control options. Some women may have to travel long distances and take time off work in order to obtain birth control. The following infographic from YourLawyer.com analyzes which U.S. states offer the best and worst access to birth control across the county.
How Did Education Change During the Pandemic?
Almost monthly, UNESCO, in particular the Bureau of Education, publishes reports on the threats to the education sector through the coronavirus. One of the statements said that due to the disrupted educational process for millions of pupils and students, the world is threatened with degradation, as the level of education of the population will significantly decrease. The following infographic explores how education changed during the Coronavirus pandemic.
50 Iconic Vehicles From Video Games
Video games are a showcase of creativity, innovation, and determination. Exploring the transportation that game designers have created highlights just how visionary video games truly are. This infographic is a collection of video game vehicles from games that span decades. There are spaceships, cars, stagecoaches, flying machines, mech suits, horses, and even giant yellow birds all illustrated to scale.
Which States Have the Most Fatal Car Accidents?
Car accidents account for 1.35 million deaths per year around the world. It is the leading cause of death for both children and young people between 5 and 29. Speed related crashes in the United States cost American drivers over 40 billion dollars a year. This map displays the deadliest states in the US for fatal car accidents per 100,000 people.
The State of the SMS Market in 2020 and Beyond
The SMS market is set to explode, with the number of text-capable phone subscriptions worldwide recently surpassing a whopping 5.1 billion. Check out the following infographic to learn more about the growth of the B2B SMS market broken down by industry and use case, consumer insights, and predictions for top future trends in the business messaging space.
Counties With the Most Alcohol-Impaired Driving Deaths in the United States
Each day, an average of 29 people across America lose their lives in car crashes that involve a drunk driver. That’s one death every 50 minutes! In 2016 alone, 28% of all traffic-related deaths in the U.S. were a result of crashes involving alcohol-impaired drivers, amounting to 10,497 lives lost. In this infographic, learn which U.S. counties have the most alcohol-impaired driving deaths.
Face Mask Report Card
Many are getting creative with the face masks they create or purchase during these times, but are they all effective? The following infographic from Sock It To Me Blog details some of the different types of face masks you’re likely to come across. You’ll gain insight into what types of masks are most likely to protect you, your friends, and your family when going out in public.
Implementation of Big Data
One aspect of digital transformation is that organizations struggle to get right is the identifying, capturing, managing and analyzing of big data. Organizations must be strategic in how they approach the collection, management and analysis of their data if they want to find the gems of insight that will provide them with a competitive edge. This infographic covers the different aspects of Big Data like what is it and challenges in managing it and why is it so popular.
Which Gas Detection Device is Right for Your Workplace?
Choosing a gas monitor or detection device depends on the nature of your workplace and how your employees interact with the space. Learn about the pros and cons of different types of gas monitors to make the right choice for your business in this infographic from PKSafety.com.
The 50 Deadliest U.S. Counties For Bicyclists
Electric bikes, scooters, and bicycles are increasing in popularity due to their low environmental impact and cost-saving benefits. They also give people an opportunity to get outside and exercise. As the number of cyclists on the road increases, so do the number of accidents. Unfortunately, these accidents can lead to serious injury or even death. Here is an infographic that looks at the 50 deadliest U.S. counties for bicyclists.
Partners






Browse Archives By Category
Animated Infographics
Business Infographics
Career & Jobs Infographics
Education Infographics
Entertainment Industry Infographics
Environmental Infographics
Finance & Money Infographics
Food & Drink Infographics
Health Infographics
Historical Infographics
Home & Garden Infographics
Internet Infographics
Law and Legal Infographics
Lifestyle Infographics
Marketing Infographics
Offbeat Infographics
Parenting Infographics
Pets & Animals Infographics
Political Infographics
Shopping Infographics
Sports and Athletic Infographics
Technology Infographics
Transportation Infographics
Travel Infographics
Video Infographics