


Search 12,100+ Infographics!

15 Top Tips on How to Travel Cheap
If you’re looking for a way to travel cheap, you should look into getting a free airline ticket. The airlines have a program that lets you get free flights if you plan on traveling with them for a certain amount of time. Usually these airlines require you to have either a business or first class ticket, and in many cases you will have to make sure your flight is booked by the airline by the first week of departure.
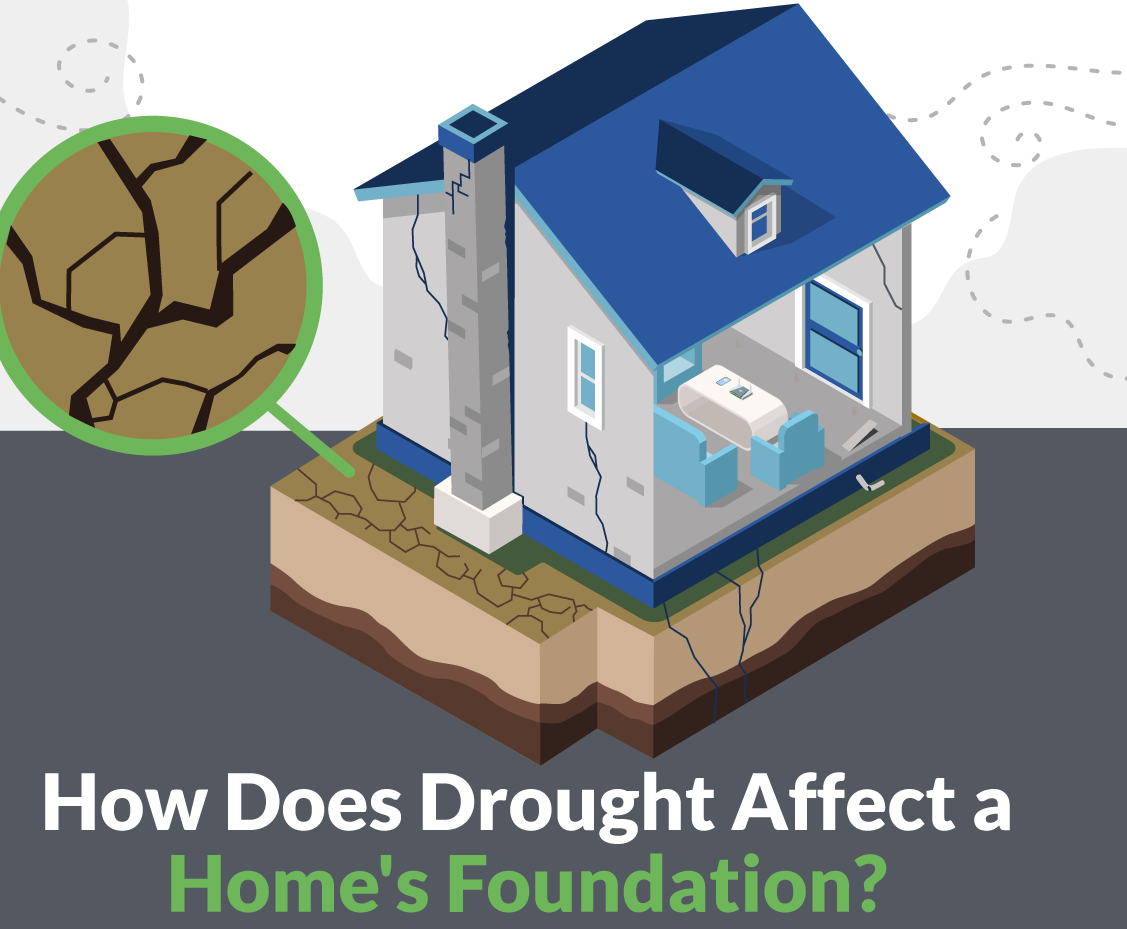
How Does Drought Affect a Home’s Foundation?
Drought conditions and persistent dryness can cause severe damage to your home. You can clearly see the changes happening above ground, but there are also major shifts happening below the ground. As the natural soil moisture dwindles, you will begin to see signs of damage to homes, roads, driveways and patios. For example, Colorado’s clay soil can make properties especially susceptible to these issues.
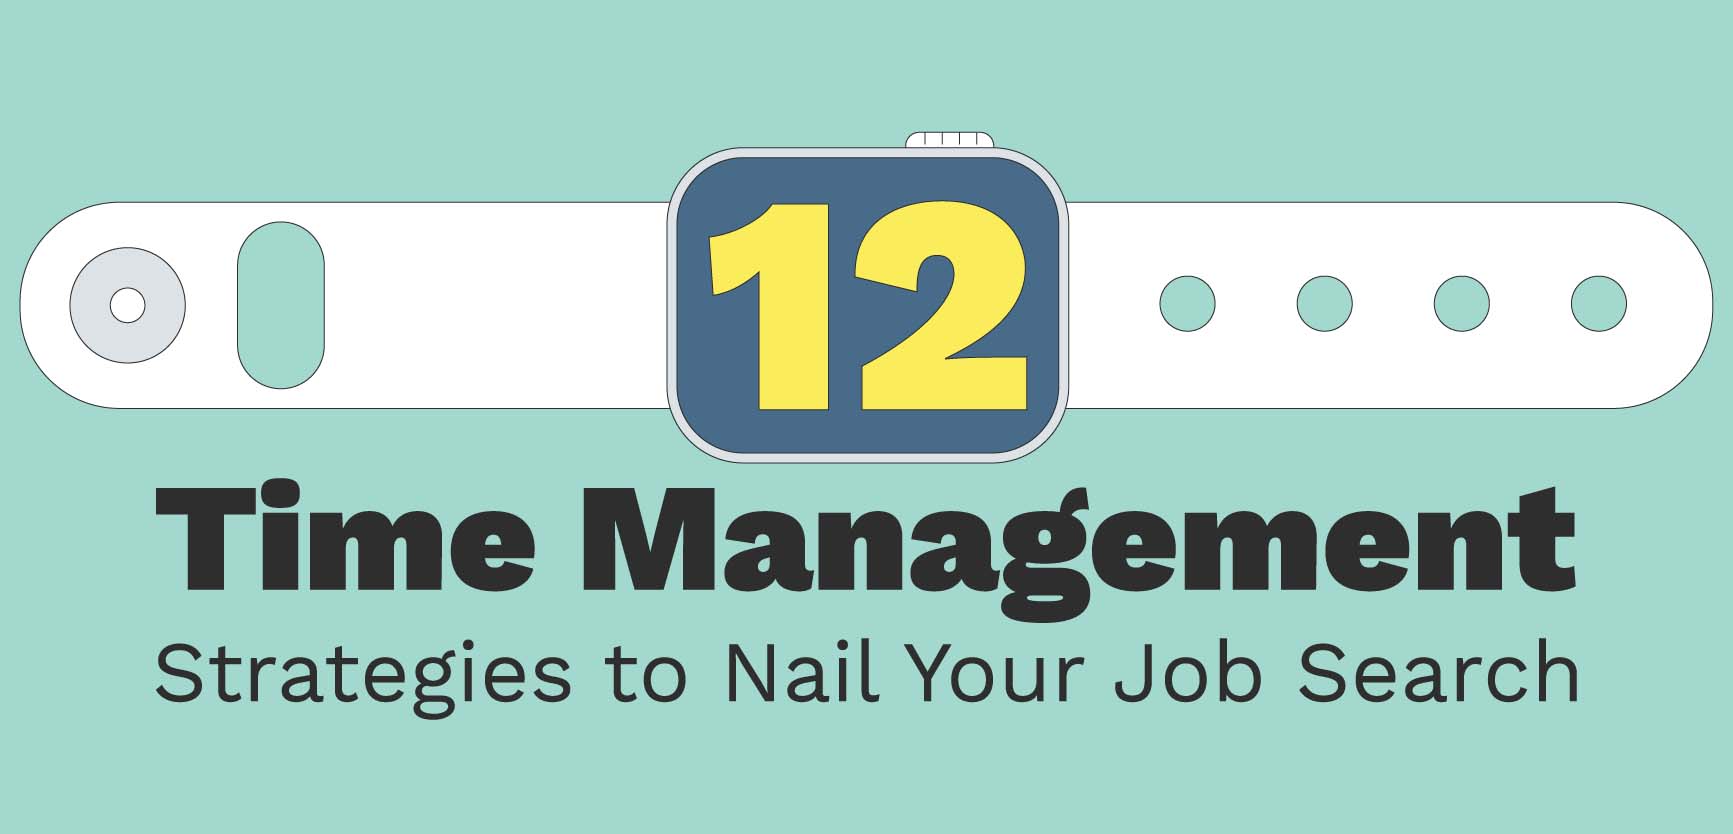
12 Time Management Strategies for Nailing Your Job Search
With the job market so saturated and competition for positions so high, job searching can feel especially stressful. Procrastinating is one of the biggest culprits of slowing down a job search — it feels like there’s so much to get done, so where do you even start? Why not look at your personality type and work backward from there? Resume Now has put together a visual guide to time management strategies.
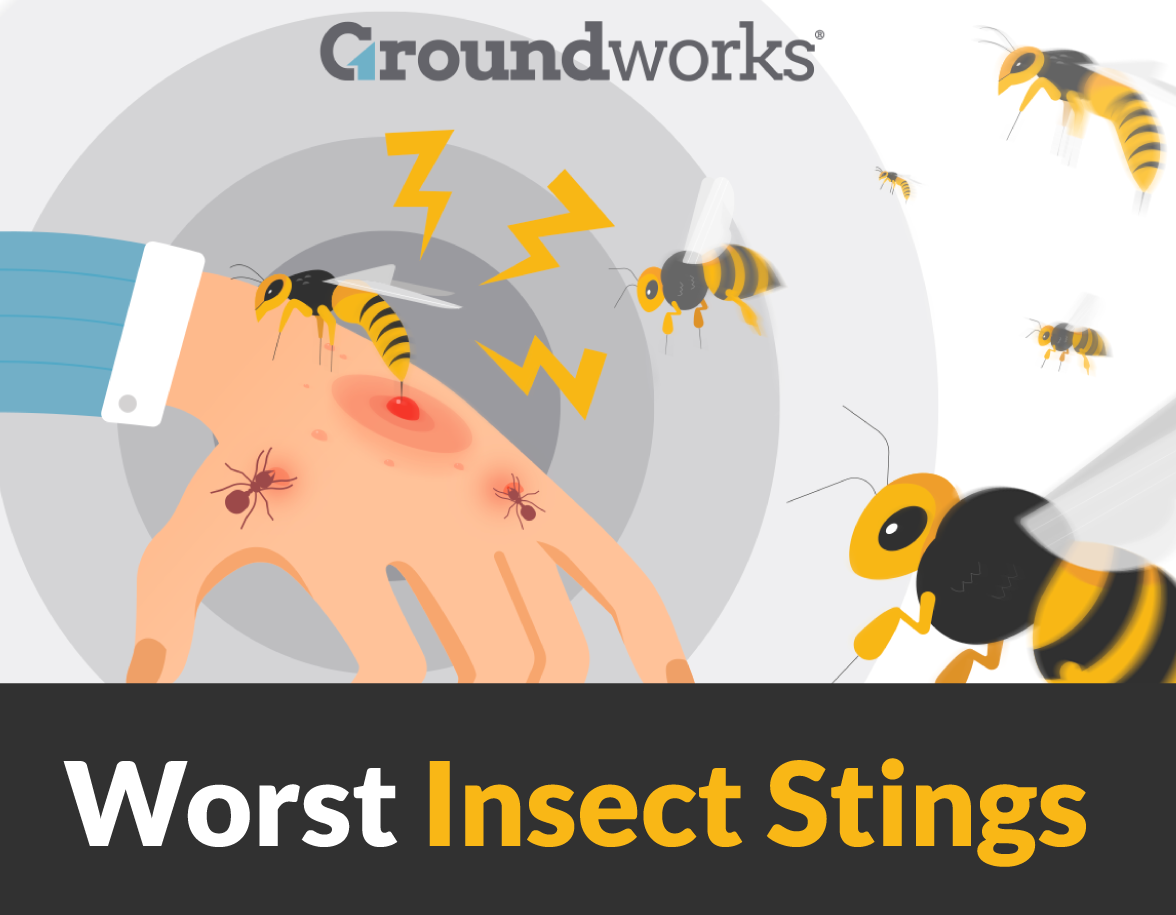
How to Stop Stinging Insects From Getting into Your Home
When outside enjoying a backyard barbeque or hiking in the park, meeting a few insects on your path is common. But when you’re inside the four walls of your own home, these common insects become much less welcome visitors. Here are some tips on keeping unwanted pests and stinging insects out of your home this summer.
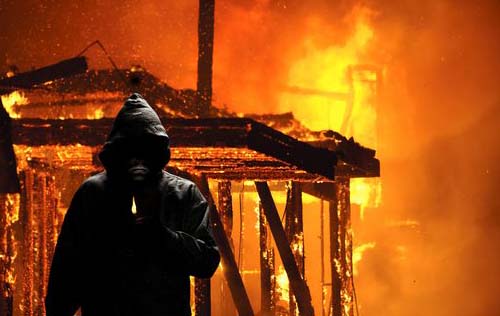
The Arson Capitals Of The United States
Property crimes are the most common crimes in the United States. One such property crime is arson — the intentional, malicious burning of property. There are many reasons why someone might commit arson. Some are arson insurance fraud cases, while others are to get revenge against another individual. In this infographic, discover the arson capitals of the United States.

How to Have an Active Lifestyle
This infographic from the team at Fitness19 dives into the benefits of having a healthy lifestyle, as well as how to maintain one efficiently. [Click image for full size version]

A Couple’s Guide to Moving in Together
Deciding to move in together is a huge step to take as a couple. This transition can be an exciting adventure, but can also pose some challenges along the way. Use this guide by TurboTenant to help you decide what to keep, toss, or donate after you move into your new place.
Overall Guide to the Healthcare Industry in Australia
Are you interested in working in the healthcare industry in Australia? What job role are you looking for? Aged carer or maybe as a registered nurse? You may be required to obtain a Criminal History Check. Here is an overall guide to the healthcare industry in Australia.

Anatomy of a Scam Survey Website
Scams are everywhere. They can be hard to determine, especially in the world of paid surveys. Here is an infographic that features some key attributes of what makes up a scam survey site to help you ensure you only use legitimate paid surveys.

Getting Ready For The UK Citizenship Test
To become a British citizen by naturalization, you need to take the British Citizenship test as part of your application for settlement in the UK. The test entails a mandatory assessment of your knowledge of British geography, history, culture, and politics. Here is a summarized process of taking the British Citizenship Test.
15 Top Tips on How to Travel Cheap
If you’re looking for a way to travel cheap, you should look into getting a free airline ticket. The airlines have a program that lets you get free flights if you plan on traveling with them for a certain amount of time. Usually these airlines require you to have either a business or first class ticket, and in many cases you will have to make sure your flight is booked by the airline by the first week of departure.
How Does Drought Affect a Home’s Foundation?
Drought conditions and persistent dryness can cause severe damage to your home. You can clearly see the changes happening above ground, but there are also major shifts happening below the ground. As the natural soil moisture dwindles, you will begin to see signs of damage to homes, roads, driveways and patios. For example, Colorado’s clay soil can make properties especially susceptible to these issues.
12 Time Management Strategies for Nailing Your Job Search
With the job market so saturated and competition for positions so high, job searching can feel especially stressful. Procrastinating is one of the biggest culprits of slowing down a job search — it feels like there’s so much to get done, so where do you even start? Why not look at your personality type and work backward from there? Resume Now has put together a visual guide to time management strategies.
How to Stop Stinging Insects From Getting into Your Home
When outside enjoying a backyard barbeque or hiking in the park, meeting a few insects on your path is common. But when you’re inside the four walls of your own home, these common insects become much less welcome visitors. Here are some tips on keeping unwanted pests and stinging insects out of your home this summer.
The Arson Capitals Of The United States
Property crimes are the most common crimes in the United States. One such property crime is arson — the intentional, malicious burning of property. There are many reasons why someone might commit arson. Some are arson insurance fraud cases, while others are to get revenge against another individual. In this infographic, discover the arson capitals of the United States.
How to Have an Active Lifestyle
This infographic from the team at Fitness19 dives into the benefits of having a healthy lifestyle, as well as how to maintain one efficiently. [Click image for full size version]
A Couple’s Guide to Moving in Together
Deciding to move in together is a huge step to take as a couple. This transition can be an exciting adventure, but can also pose some challenges along the way. Use this guide by TurboTenant to help you decide what to keep, toss, or donate after you move into your new place.
Overall Guide to the Healthcare Industry in Australia
Are you interested in working in the healthcare industry in Australia? What job role are you looking for? Aged carer or maybe as a registered nurse? You may be required to obtain a Criminal History Check. Here is an overall guide to the healthcare industry in Australia.
Anatomy of a Scam Survey Website
Scams are everywhere. They can be hard to determine, especially in the world of paid surveys. Here is an infographic that features some key attributes of what makes up a scam survey site to help you ensure you only use legitimate paid surveys.
Getting Ready For The UK Citizenship Test
To become a British citizen by naturalization, you need to take the British Citizenship test as part of your application for settlement in the UK. The test entails a mandatory assessment of your knowledge of British geography, history, culture, and politics. Here is a summarized process of taking the British Citizenship Test.
Partners


Browse Archives By Category
Animated Infographics
Business Infographics
Career & Jobs Infographics
Education Infographics
Entertainment Industry Infographics
Environmental Infographics
Finance & Money Infographics
Food & Drink Infographics
Health Infographics
Historical Infographics
Home & Garden Infographics
Internet Infographics
Law and Legal Infographics
Lifestyle Infographics
Marketing Infographics
Offbeat Infographics
Parenting Infographics
Pets & Animals Infographics
Political Infographics
Shopping Infographics
Sports and Athletic Infographics
Technology Infographics
Transportation Infographics
Travel Infographics
Video Infographics