


Search 12,100+ Infographics!

Snapchat and eCommerce
Snapchat is the largest social media platform for young consumers. It achieves 188 million active daily users. Recently, Snapchat has outperformed Facebook among US teens. With seventy percent of the users being female, there is a high willingness to buy via the mobile phone. Among the young group of buyers, Snapchat is a very attractive platform for marketers.
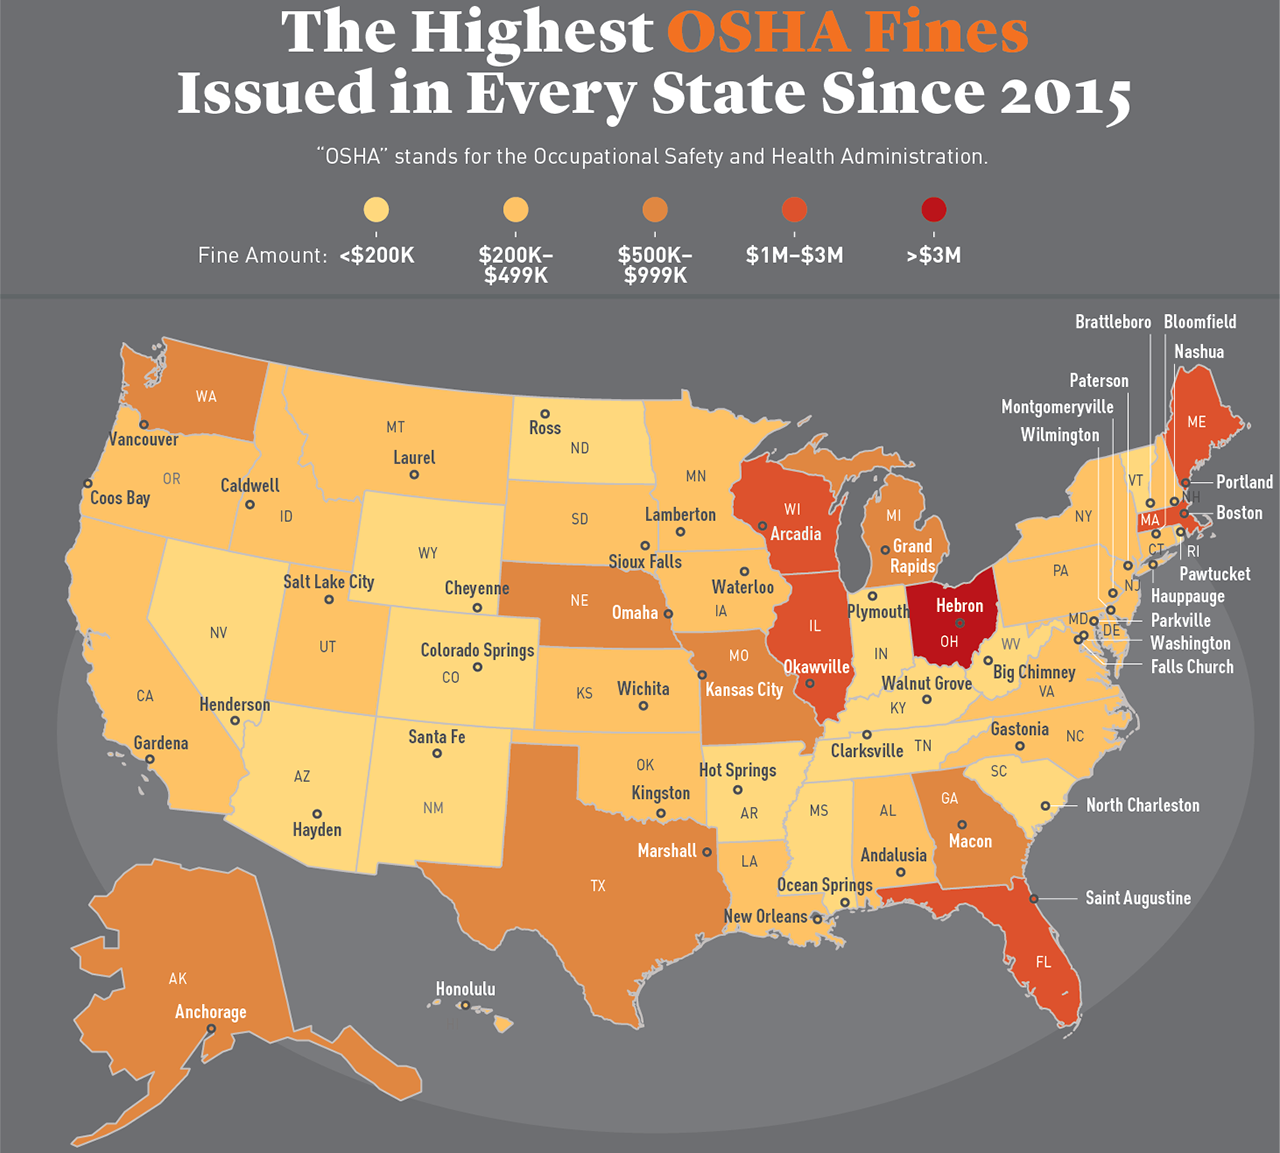
The Highest OSHA Violation in Every State Since 2015
The Occupational Safety and Heath Administration is a division of the U.S. Department of Labor. It was established under the Occupational Safety and Health Act on Dec. 29, 1970. The purpose of the organization is to ensure safe and healthful working conditions for employees through setting and enforcing standards and by providing training, education, outreach, and assistance.
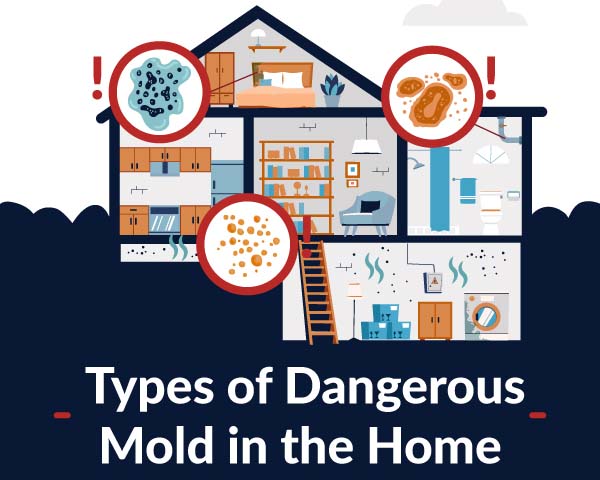
Different Types of Dangerous Mold in Our Homes
Even if you can’t see it, mold could be growing in your home and causing damage to both its interior and the home’s structural integrity. According to the US Environmental Protection Agency, mold growth can also damage the air quality inside your home, causing harm to the people who live there. Learn more about mold in your home in this infographic.

Where Natural Disasters Strike Most in the United States
From Category 5 hurricanes that sweep up the coasts to fires that ravage forests and homes alike, natural disasters in the U.S. can do tremendous damage. Some regions in particular find themselves in harm’s way more often than others. This infographic examines which counties have declared the most natural disaster emergencies and how many of each natural disaster they’ve experienced.

8 Ways Machine Learning is Revolutionizing Supply Chain Management
Machine learning provides an opportunity to business owners who wants to reduce costs, increase profits and enhance customer satisfaction. Let’s check how it is revolutionizing supply chain management via the following infographic.

Client Accounting Services – The Future of CPA Firms
In recent years, the accounting industry has undergone technological advancements and introduced the concept of CAS (Client Accounting Services), which is becoming very popular among customers. Learn more about CAS in this infographic from Cogneesol.
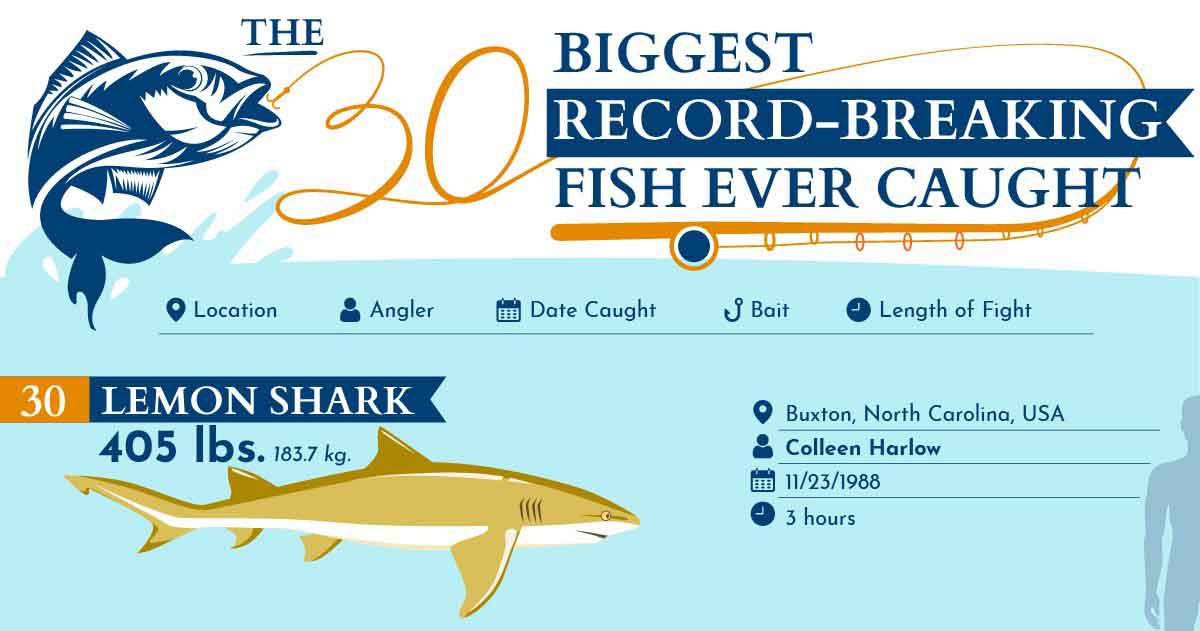
The 30 Biggest Record-Breaking Fish Ever Caught
What was the biggest fish ever caught? It’s massive size will amaze you, along with the 29 other gigantic fish that made this list. See which 30 fish broke International Game Fish Association records in this infographic from MY Yachts Sales.

The Best Time to Post on Social Media in 2020
Social Media is the best platform to promote your content and make it go viral. But the question is, what is the best time to upload your content on different platforms? There is no ideal answer to this because the best time to upload your content will always depend on the type of social media platform you are using. If you want to stay one step ahead your competitors, then you must know the best time and day to post your content on the social media platform.

Restaurant Recovery: Contactless Dining, Labor Optimization & the Customer Journey
Restaurants must function at 75% capacity in order to achieve profitability. With many restaurants operating at 50% capacity or less, how do they make up the remaining 25%? The three main contributing factors are contactless dining, labor optimization and changing the customer journey. Learn more about how restaurants are recovering during the COVID-19 pandemic in this infographic.

Superheroes Ranked by Their Box Office Earnings
Superhero movies are incredibly popular right now. Avengers: Endgame made more than $2.7 billion worldwide in 2019, making it the highest-grossing film of all time. Their popularity is not showing any signs of stopping, either. Both Marvel and DC have multiple projects in the works.
Snapchat and eCommerce
Snapchat is the largest social media platform for young consumers. It achieves 188 million active daily users. Recently, Snapchat has outperformed Facebook among US teens. With seventy percent of the users being female, there is a high willingness to buy via the mobile phone. Among the young group of buyers, Snapchat is a very attractive platform for marketers.
The Highest OSHA Violation in Every State Since 2015
The Occupational Safety and Heath Administration is a division of the U.S. Department of Labor. It was established under the Occupational Safety and Health Act on Dec. 29, 1970. The purpose of the organization is to ensure safe and healthful working conditions for employees through setting and enforcing standards and by providing training, education, outreach, and assistance.
Different Types of Dangerous Mold in Our Homes
Even if you can’t see it, mold could be growing in your home and causing damage to both its interior and the home’s structural integrity. According to the US Environmental Protection Agency, mold growth can also damage the air quality inside your home, causing harm to the people who live there. Learn more about mold in your home in this infographic.
Where Natural Disasters Strike Most in the United States
From Category 5 hurricanes that sweep up the coasts to fires that ravage forests and homes alike, natural disasters in the U.S. can do tremendous damage. Some regions in particular find themselves in harm’s way more often than others. This infographic examines which counties have declared the most natural disaster emergencies and how many of each natural disaster they’ve experienced.
8 Ways Machine Learning is Revolutionizing Supply Chain Management
Machine learning provides an opportunity to business owners who wants to reduce costs, increase profits and enhance customer satisfaction. Let’s check how it is revolutionizing supply chain management via the following infographic.
Client Accounting Services – The Future of CPA Firms
In recent years, the accounting industry has undergone technological advancements and introduced the concept of CAS (Client Accounting Services), which is becoming very popular among customers. Learn more about CAS in this infographic from Cogneesol.
The 30 Biggest Record-Breaking Fish Ever Caught
What was the biggest fish ever caught? It’s massive size will amaze you, along with the 29 other gigantic fish that made this list. See which 30 fish broke International Game Fish Association records in this infographic from MY Yachts Sales.
The Best Time to Post on Social Media in 2020
Social Media is the best platform to promote your content and make it go viral. But the question is, what is the best time to upload your content on different platforms? There is no ideal answer to this because the best time to upload your content will always depend on the type of social media platform you are using. If you want to stay one step ahead your competitors, then you must know the best time and day to post your content on the social media platform.
Restaurant Recovery: Contactless Dining, Labor Optimization & the Customer Journey
Restaurants must function at 75% capacity in order to achieve profitability. With many restaurants operating at 50% capacity or less, how do they make up the remaining 25%? The three main contributing factors are contactless dining, labor optimization and changing the customer journey. Learn more about how restaurants are recovering during the COVID-19 pandemic in this infographic.
Superheroes Ranked by Their Box Office Earnings
Superhero movies are incredibly popular right now. Avengers: Endgame made more than $2.7 billion worldwide in 2019, making it the highest-grossing film of all time. Their popularity is not showing any signs of stopping, either. Both Marvel and DC have multiple projects in the works.
Partners


Browse Archives By Category
Animated Infographics
Business Infographics
Career & Jobs Infographics
Education Infographics
Entertainment Industry Infographics
Environmental Infographics
Finance & Money Infographics
Food & Drink Infographics
Health Infographics
Historical Infographics
Home & Garden Infographics
Internet Infographics
Law and Legal Infographics
Lifestyle Infographics
Marketing Infographics
Offbeat Infographics
Parenting Infographics
Pets & Animals Infographics
Political Infographics
Shopping Infographics
Sports and Athletic Infographics
Technology Infographics
Transportation Infographics
Travel Infographics
Video Infographics