


Search 12,100+ Infographics!

Process On How Safety Glasses Are Made
Investing in the right safety glasses is not a decision to be taken lightly. Whether you wear these goggles for work, when playing sports, or while at the shooting range, you want to be certain the ones you pick are up for the job. Understanding what makes for a quality pair of glasses comes down to understanding a few critical details about how safety eye-wear is made. This infographic looks at the process on how safety glasses are made.
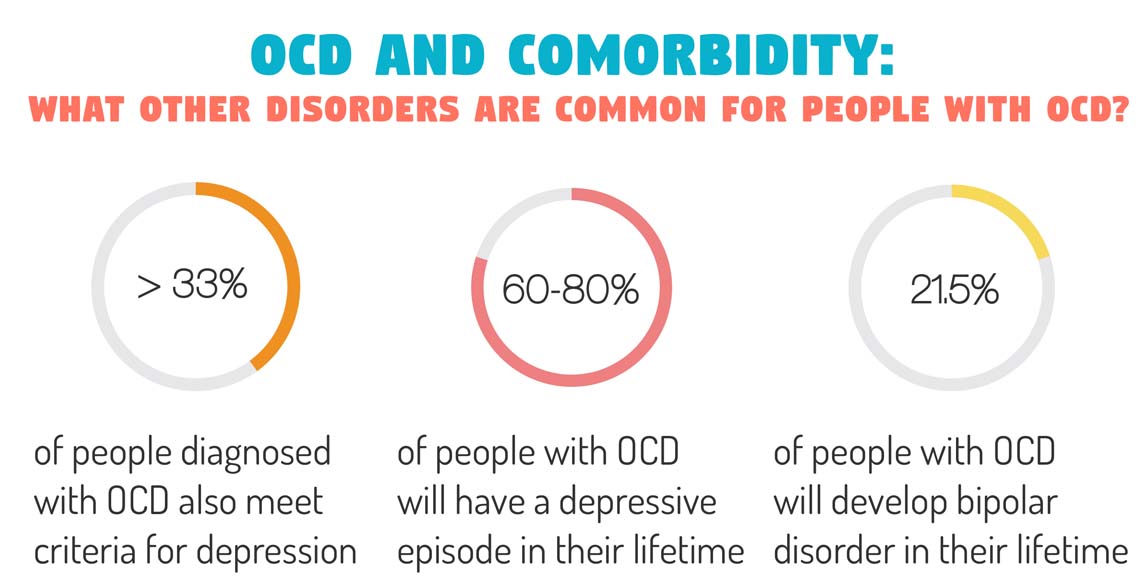
OCD and Comorbidity
Dealing with OCD is already difficult! But many people also deal with other mental health conditions at the same time commonly known as comorbidity. Which are most common, and what can people do? Learn more in the following infographic.
Medical Coding And Its Prime Importance
Medical coding is a critical aspect in the healthcare billing process. It ensures accurate payment for physicians and also creates a valid record of patient history. In this infographic, you will learn what medical coding services are, the role of medical coders in the healthcare billing cycle, importance of coding and the different types of codes used currently.

5 Habits of Successful Customer Service Agents
Some find working at customer support stressful, while others have cracked the tricks to scoring high in every customer interaction. It could very well be that there are innate qualities that make it easier for some people to succeed in this field. In this infographic, Klaus looks at 5 habits of successful customer service agents.

Maximize Your Money With A Growth Mindset
53% of Americans feel anxious thinking about money, but those with higher financial literacy are more likely to overcome financial shocks. Below, Money Hacker explains how to overcome the stigma of socioeconomics. How are your finances?

What Information Are Giant Tech Companies Collecting From You?
What information are some of the largest tech companies in the world collecting on their users and profiting off of as they sell this information to third parties and advertisers?From facial recognition data to your mouse movements, you’ll be shocked at just how much they know about you. The following infographic, courtesy of TruePeopleSearch.com, lays it all out.

The Global Emission of Sulfur Dioxide You Must Know
Sulfur dioxide has a serious impact on the air quality of various countries around the world. So far, which country is the most polluted by sulfur dioxide emissions? In the following infographic, look at data on the global impact of Sulfur Dioxide and how raw coal desulfurization can save us.

Top 10 Famous Steel Structures in The World
Steel is one of the most used metals for building and construction to construct some mesmerizing buildings through decades. Alongside the strength and durability, metal buildings are cost-effective, time and energy-efficient, portable, fully customizable, DIYable, etc. Where traditional structures have several limitations, steel structures overcome all these drawbacks and serve reliable features.

Evolution Of Poker Bots
Here is a brief evolution of how artificial intelligence software has evolved into what it is today and what it can bring to the future of poker, all compiled into an infographic by The Best Poker Sites.

Why Game-Based Learning Will Make Your Child Smarter
Game Based learning in simple terms is the use of gaming with educational goals that support a child’s development and growth. Game based learning promotes analytical thinking and logical reasoning. It also enhances problem solving and collaborative thinking among kids. In this infographic, explore why game-based learning will make your child smarter.
Process On How Safety Glasses Are Made
Investing in the right safety glasses is not a decision to be taken lightly. Whether you wear these goggles for work, when playing sports, or while at the shooting range, you want to be certain the ones you pick are up for the job. Understanding what makes for a quality pair of glasses comes down to understanding a few critical details about how safety eye-wear is made. This infographic looks at the process on how safety glasses are made.
OCD and Comorbidity
Dealing with OCD is already difficult! But many people also deal with other mental health conditions at the same time commonly known as comorbidity. Which are most common, and what can people do? Learn more in the following infographic.
Medical Coding And Its Prime Importance
Medical coding is a critical aspect in the healthcare billing process. It ensures accurate payment for physicians and also creates a valid record of patient history. In this infographic, you will learn what medical coding services are, the role of medical coders in the healthcare billing cycle, importance of coding and the different types of codes used currently.
5 Habits of Successful Customer Service Agents
Some find working at customer support stressful, while others have cracked the tricks to scoring high in every customer interaction. It could very well be that there are innate qualities that make it easier for some people to succeed in this field. In this infographic, Klaus looks at 5 habits of successful customer service agents.
Maximize Your Money With A Growth Mindset
53% of Americans feel anxious thinking about money, but those with higher financial literacy are more likely to overcome financial shocks. Below, Money Hacker explains how to overcome the stigma of socioeconomics. How are your finances?
What Information Are Giant Tech Companies Collecting From You?
What information are some of the largest tech companies in the world collecting on their users and profiting off of as they sell this information to third parties and advertisers?From facial recognition data to your mouse movements, you’ll be shocked at just how much they know about you. The following infographic, courtesy of TruePeopleSearch.com, lays it all out.
The Global Emission of Sulfur Dioxide You Must Know
Sulfur dioxide has a serious impact on the air quality of various countries around the world. So far, which country is the most polluted by sulfur dioxide emissions? In the following infographic, look at data on the global impact of Sulfur Dioxide and how raw coal desulfurization can save us.
Top 10 Famous Steel Structures in The World
Steel is one of the most used metals for building and construction to construct some mesmerizing buildings through decades. Alongside the strength and durability, metal buildings are cost-effective, time and energy-efficient, portable, fully customizable, DIYable, etc. Where traditional structures have several limitations, steel structures overcome all these drawbacks and serve reliable features.
Evolution Of Poker Bots
Here is a brief evolution of how artificial intelligence software has evolved into what it is today and what it can bring to the future of poker, all compiled into an infographic by The Best Poker Sites.
Why Game-Based Learning Will Make Your Child Smarter
Game Based learning in simple terms is the use of gaming with educational goals that support a child’s development and growth. Game based learning promotes analytical thinking and logical reasoning. It also enhances problem solving and collaborative thinking among kids. In this infographic, explore why game-based learning will make your child smarter.
Partners


Browse Archives By Category
Animated Infographics
Business Infographics
Career & Jobs Infographics
Education Infographics
Entertainment Industry Infographics
Environmental Infographics
Finance & Money Infographics
Food & Drink Infographics
Health Infographics
Historical Infographics
Home & Garden Infographics
Internet Infographics
Law and Legal Infographics
Lifestyle Infographics
Marketing Infographics
Offbeat Infographics
Parenting Infographics
Pets & Animals Infographics
Political Infographics
Shopping Infographics
Sports and Athletic Infographics
Technology Infographics
Transportation Infographics
Travel Infographics
Video Infographics