


Search 12,100+ Infographics!

8 Reasons Why Bamboo Clothing is Good for the Environment
The popularity of bamboo clothing is on the rise as an eco-friendly, sustainable, and economical alternative to cotton. Bamboo is being considered as an excellent fabric choice among clothing manufacturers and retailers because it is less harmful to the environment than cotton. Not only is bamboo less harmful to the environment than cotton; when used in clothing, the bamboo fabric also offers many beneficial attributes compared to cotton fabric.
How To Come Up With The Perfect Business Name
You created a smart business plan. You perfected your product or service, and you even scoped out your competition. The final step is coming up with the perfect business name, and that’s no easy task. Choosing the right name for your business will impact your marketing and branding efforts while selecting the wrong name can result in failing to connect with your customer, and even impact your success.
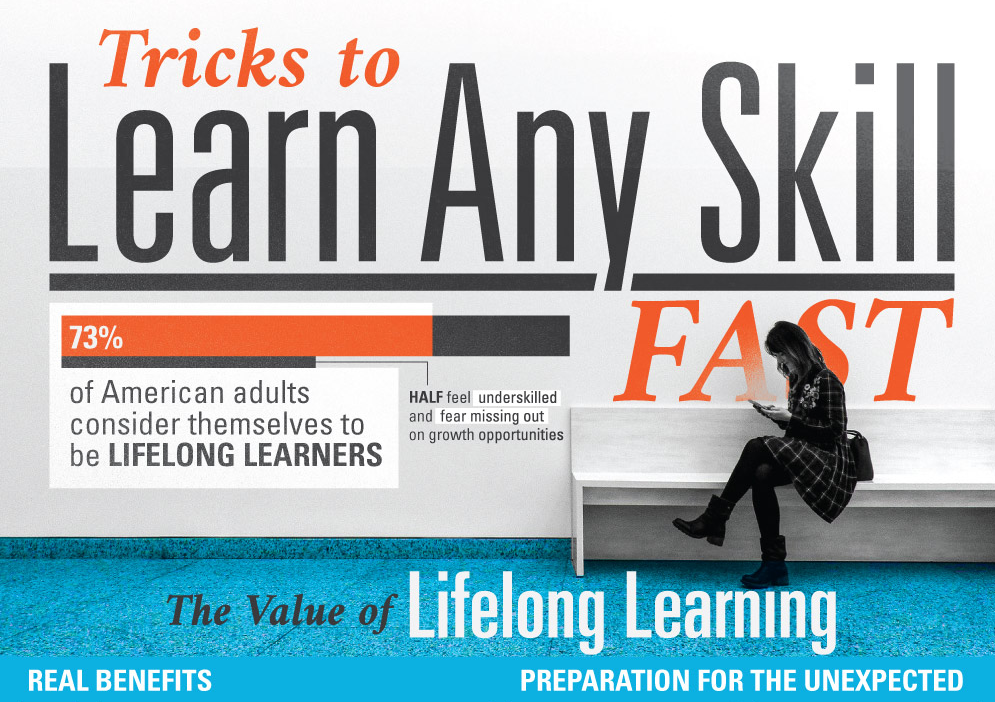
Tricks For Learning New Skills Fast
Learning new things keeps our mental health in check and helps us have a sense of purpose. Learn how to learn new skills fast from this infographic from Fast Online Master’s.

U.S. Amusement Parks With the Most Deaths & Injuries the Past 10 Years
Thrills and danger are often two sides of the same coin. Roller-coasters are an excellent example of this dynamic. The fear of cars flying off the track, support beams collapsing, or safety bars failing pop into the minds of riders, making their hearts pound all the more. Fortunately, roller-coaster accidents are relatively rare. In fact, the likelihood of dying on a roller coaster is one in 750 million.
Chapter 7 vs Chapter 13 Bankruptcy
Nobody wants to file for bankruptcy, but it’s a key safety net for certain situations. When considering bankruptcy, it’s important to understand the differences between Chapter 7 and Chapter 13 Bankruptcy. This infographic highlights the primary differences between the two in a Chapter 7 vs Chapter 13 comparison.
Tips For Hiking With Your Dog
Hiking is an activity that helps promote better health and weight management. Research has shown that hiking helps calm anxiety and lower the risk of depression. One of the best ways to enjoy it is, of course, to take your furry friend with you. Here is a visual complete guide on hiking with your dog. Learn the safety tips and what to pack for hiking.
Fatalities of the 9/11 Terrorist Attacks: Then And Now
The 9/11 terrorist attacks began what is now known as the War on Terror, but how many lives were lost of that tragic day? This infographic represents the almost 3,000 fatalities from that day, broken down into ranks of the brave first responders that courageously gave their lives to help others.

Why Branding is Essential for B2B Brands
For years branding belonged to B2C sites. B2B sites were mostly bland, formal and lacked a distinct brand flavor. But it’s 2020. And as customers get used to superior, self-service experiences, B2B brands cannot afford to be behind the curve. The stats and info in this infographic throws light on why branding is essential for B2B and how it can propel long-term growth.

How to Find Work in the Remote Economy
It’s difficult to find your dream job, but Nine2FiveJobSearch has trips to guide you. The world of work has gone extremely remote. Do you know how to find work?
Boosting Your Business With Strategic Gifting
Every interaction with a prospect, lead, or customer has potential to add value to an organization. Whether you’re sending emails, making phone calls, or paying for ads, each point of communication can impact a business. How do you stand out and still communicate value? From prospecting, to booking meetings, to customers retention, reciprocating each interaction with genuinely personalized gifts will boost your business.
8 Reasons Why Bamboo Clothing is Good for the Environment
The popularity of bamboo clothing is on the rise as an eco-friendly, sustainable, and economical alternative to cotton. Bamboo is being considered as an excellent fabric choice among clothing manufacturers and retailers because it is less harmful to the environment than cotton. Not only is bamboo less harmful to the environment than cotton; when used in clothing, the bamboo fabric also offers many beneficial attributes compared to cotton fabric.
How To Come Up With The Perfect Business Name
You created a smart business plan. You perfected your product or service, and you even scoped out your competition. The final step is coming up with the perfect business name, and that’s no easy task. Choosing the right name for your business will impact your marketing and branding efforts while selecting the wrong name can result in failing to connect with your customer, and even impact your success.
Tricks For Learning New Skills Fast
Learning new things keeps our mental health in check and helps us have a sense of purpose. Learn how to learn new skills fast from this infographic from Fast Online Master’s.
U.S. Amusement Parks With the Most Deaths & Injuries the Past 10 Years
Thrills and danger are often two sides of the same coin. Roller-coasters are an excellent example of this dynamic. The fear of cars flying off the track, support beams collapsing, or safety bars failing pop into the minds of riders, making their hearts pound all the more. Fortunately, roller-coaster accidents are relatively rare. In fact, the likelihood of dying on a roller coaster is one in 750 million.
Chapter 7 vs Chapter 13 Bankruptcy
Nobody wants to file for bankruptcy, but it’s a key safety net for certain situations. When considering bankruptcy, it’s important to understand the differences between Chapter 7 and Chapter 13 Bankruptcy. This infographic highlights the primary differences between the two in a Chapter 7 vs Chapter 13 comparison.
Tips For Hiking With Your Dog
Hiking is an activity that helps promote better health and weight management. Research has shown that hiking helps calm anxiety and lower the risk of depression. One of the best ways to enjoy it is, of course, to take your furry friend with you. Here is a visual complete guide on hiking with your dog. Learn the safety tips and what to pack for hiking.
Fatalities of the 9/11 Terrorist Attacks: Then And Now
The 9/11 terrorist attacks began what is now known as the War on Terror, but how many lives were lost of that tragic day? This infographic represents the almost 3,000 fatalities from that day, broken down into ranks of the brave first responders that courageously gave their lives to help others.
Why Branding is Essential for B2B Brands
For years branding belonged to B2C sites. B2B sites were mostly bland, formal and lacked a distinct brand flavor. But it’s 2020. And as customers get used to superior, self-service experiences, B2B brands cannot afford to be behind the curve. The stats and info in this infographic throws light on why branding is essential for B2B and how it can propel long-term growth.
How to Find Work in the Remote Economy
It’s difficult to find your dream job, but Nine2FiveJobSearch has trips to guide you. The world of work has gone extremely remote. Do you know how to find work?
Boosting Your Business With Strategic Gifting
Every interaction with a prospect, lead, or customer has potential to add value to an organization. Whether you’re sending emails, making phone calls, or paying for ads, each point of communication can impact a business. How do you stand out and still communicate value? From prospecting, to booking meetings, to customers retention, reciprocating each interaction with genuinely personalized gifts will boost your business.
Partners


Browse Archives By Category
Animated Infographics
Business Infographics
Career & Jobs Infographics
Education Infographics
Entertainment Industry Infographics
Environmental Infographics
Finance & Money Infographics
Food & Drink Infographics
Health Infographics
Historical Infographics
Home & Garden Infographics
Internet Infographics
Law and Legal Infographics
Lifestyle Infographics
Marketing Infographics
Offbeat Infographics
Parenting Infographics
Pets & Animals Infographics
Political Infographics
Shopping Infographics
Sports and Athletic Infographics
Technology Infographics
Transportation Infographics
Travel Infographics
Video Infographics