


Search 12,100+ Infographics!

UK Theme Parks
The United Kingdom features more than 40 theme parks. From the sprawling 910-acre Alton Towers with its extensive collection of rides to the immensely popular Legoland, each one promises a great day out for the entire family. In terms of visitor numbers, Legoland is the most visited UK theme park, attracting well over 2 million people in 2018. Alton Towers isn’t far behind, drawing more than 2 million visitors.

Do Airbnb Landlords Deserve a Bailout?
It’s no secret that Airbnb hosts have been decimated by the Covid-19 pandemic. It’s helpful to put some numbers to it. How much are hosts around the world actually losing each month? How many hosts have overextended themselves with running multiple properties and now facing extreme financial pressure and liabilities? Do Airbnb landlords deserve a bailout?

PowerPoint Shortcuts
How many hours do you spend in front of a PC daily? Do you use the device for work? It is most likely that you’ve already used such key combinations as “Ctrl+C” and “Ctrl+V” while working with text, images, or any other materials. These are hotkeys that are designed to simplify user work. In the following infographic, discover some frequently used PowerPoint shortcuts.
Education Technology: How Technology is Changing Teaching
Education technology comes in many forms including websites, apps and online courses, and is effective when used both inside of the classroom alongside other teaching methods and at home for self-study. Education technology has many benefits in teaching and overcomes many of the boundaries that traditional methods of teaching present to us such as large classroom sizes and lack of funding.

Marvel Universe
Marvel Studios have created the most eye-catching characters of the decade. Amadine pays tribute to all-time fan favorites and has created the following infographic which illustrates various data on the most popular heroes and their performance, top box office, interesting facts about movies, and more.
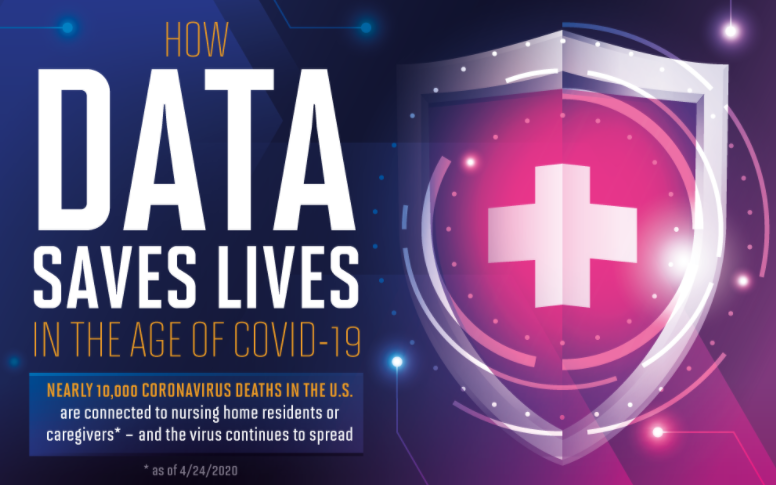
How Data Saves Lives In The Age of COVID-19
American seniors at dying at alarming rates due to COVID-19, but there is a solution. MegaData explains how smart technology can detect COVID-19 up to two weeks earlier than temperature checks. The answer to COVID-19 is in data. [Click image for full size version]...
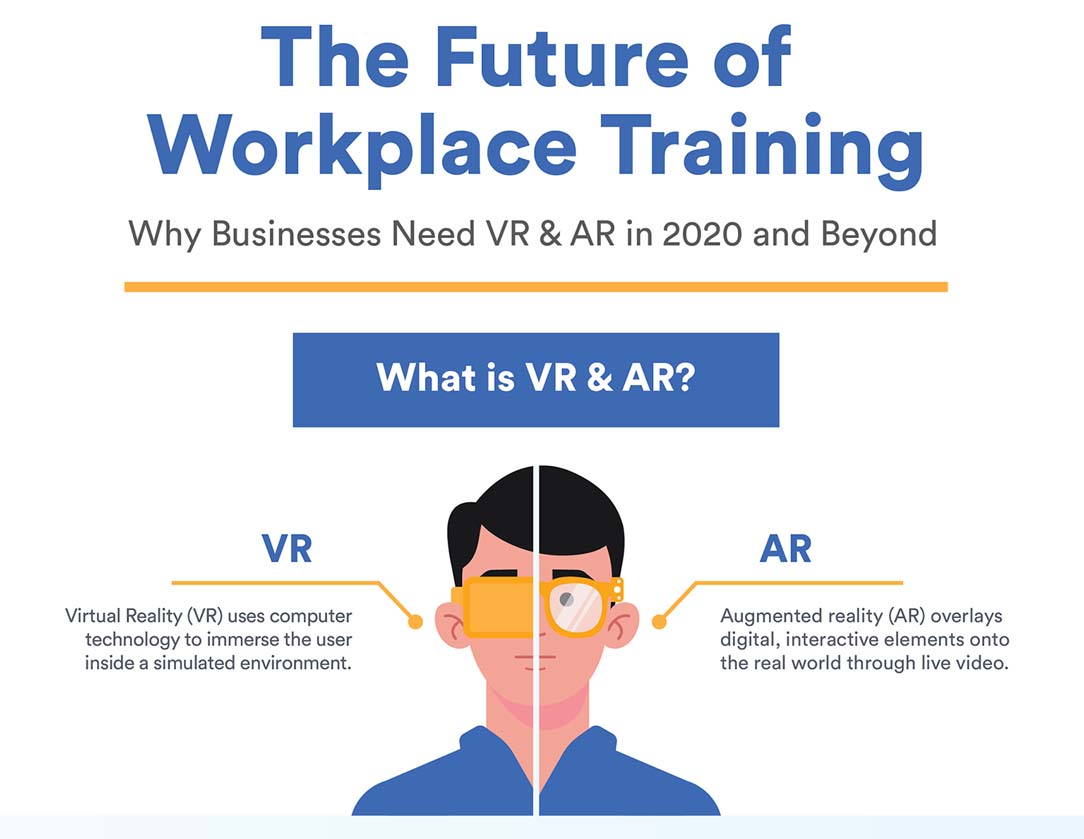
The Future Of Workplace AR & VR Training
You and your staff are always learning new skills on the job, however as your business evolves in the digital age, so must your workplace training procedures. It’s up to you to future-proof your work processes and explore new and effective ways to engage your employees at every level. We’ve seen augmented reality and virtual reality technology grow in the past few years and it shows no sign of slowing down.

Face Masks: Everything You Need To Know To Flatten The Curve
You may be conscious of wearing a face mask, but do you know the science behind how masks work? Survival At Home explains everything you need to know about masks, from cleaning to creating your own. Are you staying safe?

The 44 Closest Stars and How They Compare to Our Sun
This infographic explores the 44 closest stars to our planet after the Sun, providing fascinating data on the distance, size, luminosity, constellation, system, and potential planets of each stellar neighbor. The staggering distance between each star sheds light on just how truly colossal the universe is.
10 Facts About Blast Abrasives
Blast abrasives are an essential part of many industrial and constructions projects around the world. In this infographic, TCR Blast Abrasives highlight ten interesting facts about blast abrasive media and its uses.
UK Theme Parks
The United Kingdom features more than 40 theme parks. From the sprawling 910-acre Alton Towers with its extensive collection of rides to the immensely popular Legoland, each one promises a great day out for the entire family. In terms of visitor numbers, Legoland is the most visited UK theme park, attracting well over 2 million people in 2018. Alton Towers isn’t far behind, drawing more than 2 million visitors.
Do Airbnb Landlords Deserve a Bailout?
It’s no secret that Airbnb hosts have been decimated by the Covid-19 pandemic. It’s helpful to put some numbers to it. How much are hosts around the world actually losing each month? How many hosts have overextended themselves with running multiple properties and now facing extreme financial pressure and liabilities? Do Airbnb landlords deserve a bailout?
PowerPoint Shortcuts
How many hours do you spend in front of a PC daily? Do you use the device for work? It is most likely that you’ve already used such key combinations as “Ctrl+C” and “Ctrl+V” while working with text, images, or any other materials. These are hotkeys that are designed to simplify user work. In the following infographic, discover some frequently used PowerPoint shortcuts.
Education Technology: How Technology is Changing Teaching
Education technology comes in many forms including websites, apps and online courses, and is effective when used both inside of the classroom alongside other teaching methods and at home for self-study. Education technology has many benefits in teaching and overcomes many of the boundaries that traditional methods of teaching present to us such as large classroom sizes and lack of funding.
Marvel Universe
Marvel Studios have created the most eye-catching characters of the decade. Amadine pays tribute to all-time fan favorites and has created the following infographic which illustrates various data on the most popular heroes and their performance, top box office, interesting facts about movies, and more.
How Data Saves Lives In The Age of COVID-19
American seniors at dying at alarming rates due to COVID-19, but there is a solution. MegaData explains how smart technology can detect COVID-19 up to two weeks earlier than temperature checks. The answer to COVID-19 is in data. [Click image for full size version]...
The Future Of Workplace AR & VR Training
You and your staff are always learning new skills on the job, however as your business evolves in the digital age, so must your workplace training procedures. It’s up to you to future-proof your work processes and explore new and effective ways to engage your employees at every level. We’ve seen augmented reality and virtual reality technology grow in the past few years and it shows no sign of slowing down.
Face Masks: Everything You Need To Know To Flatten The Curve
You may be conscious of wearing a face mask, but do you know the science behind how masks work? Survival At Home explains everything you need to know about masks, from cleaning to creating your own. Are you staying safe?
The 44 Closest Stars and How They Compare to Our Sun
This infographic explores the 44 closest stars to our planet after the Sun, providing fascinating data on the distance, size, luminosity, constellation, system, and potential planets of each stellar neighbor. The staggering distance between each star sheds light on just how truly colossal the universe is.
10 Facts About Blast Abrasives
Blast abrasives are an essential part of many industrial and constructions projects around the world. In this infographic, TCR Blast Abrasives highlight ten interesting facts about blast abrasive media and its uses.
Partners


Browse Archives By Category
Animated Infographics
Business Infographics
Career & Jobs Infographics
Education Infographics
Entertainment Industry Infographics
Environmental Infographics
Finance & Money Infographics
Food & Drink Infographics
Health Infographics
Historical Infographics
Home & Garden Infographics
Internet Infographics
Law and Legal Infographics
Lifestyle Infographics
Marketing Infographics
Offbeat Infographics
Parenting Infographics
Pets & Animals Infographics
Political Infographics
Shopping Infographics
Sports and Athletic Infographics
Technology Infographics
Transportation Infographics
Travel Infographics
Video Infographics