


Search 12,100+ Infographics!

Maternal Cardiac Arrest is on the Rise
1 in 12,000 pregnant women in the US goes into sudden cardiac arrest and the trend is increasing. The good news is that they can be treated with CPR and defibrillation from an AED Machine. The bad news is that few people know of this issue and therefore respond to help women in need. Here is an infographic that shares the facts on maternal cardiac arrest and what you can do to help save lives.

Five Trend-Setting Jewelry Styles in 2020
When a new year draws to a close, many trends are shifting. Some of those improvements are the sense of style in jewelry. You may not fully change your look this 2020 but what you can do is to update it. To help you start with that, this infographic looks at the five best jewelry trends in 2020 that you can fit to your wardrobe.
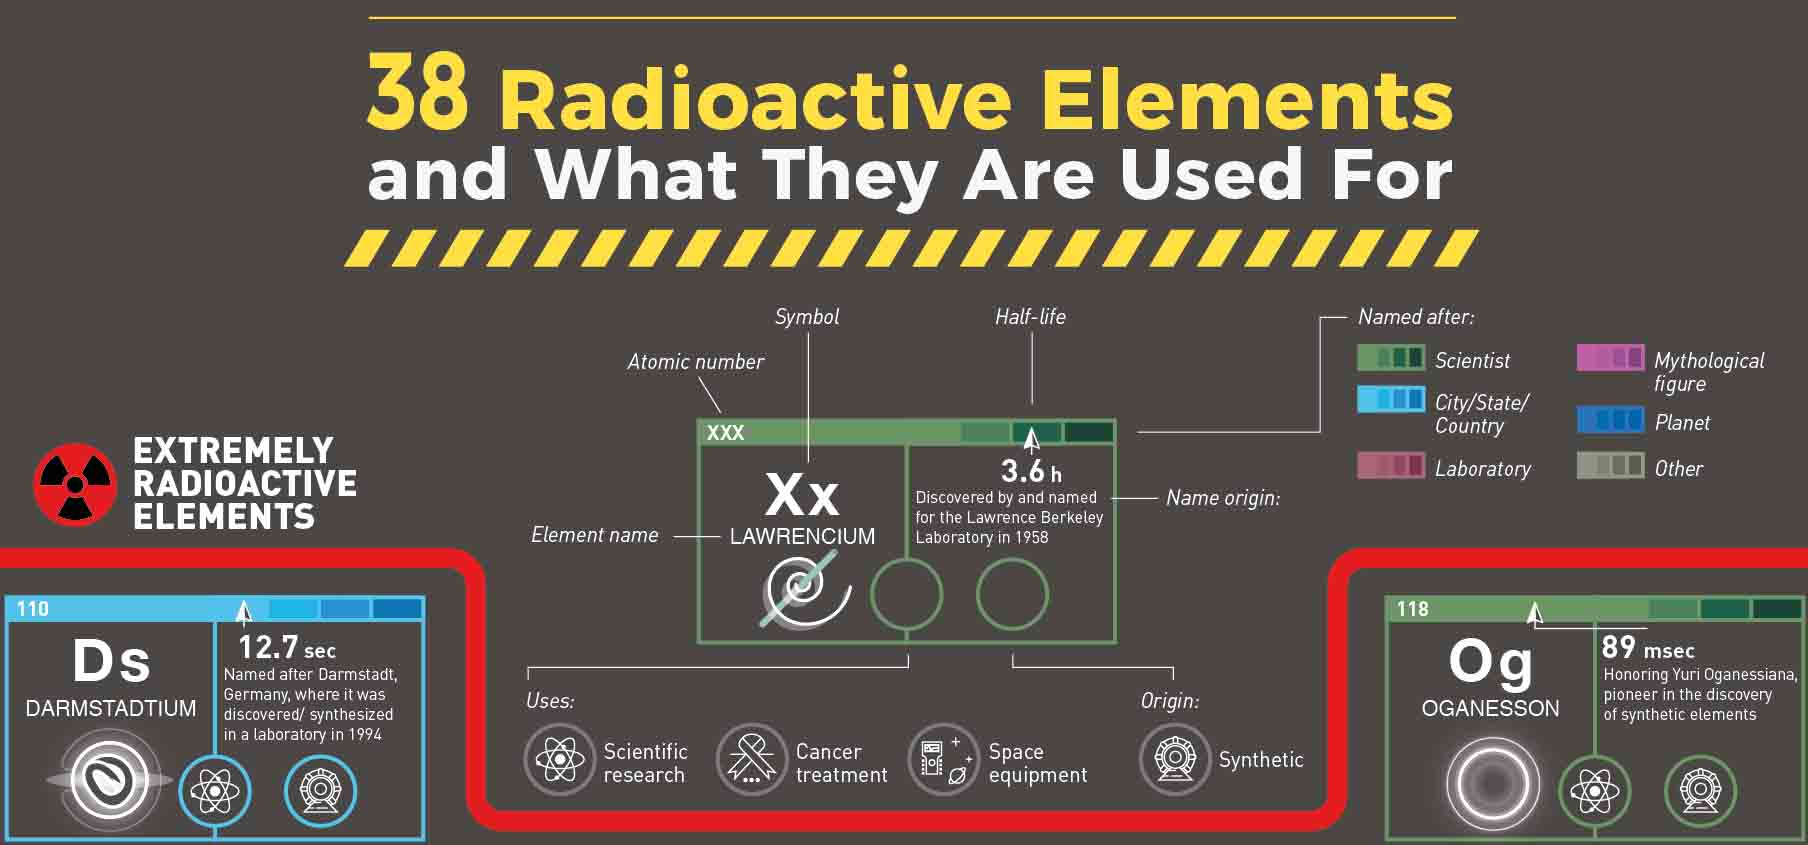
38 Radioactive Elements and What They Are Used For
The radioactivity of an element depends on what isotope is present. Polonium-210 for example is regarded as an extremely volatile, dangerous, and radioactive isotope. By mass, polonium-210 is nearly 250,000 times more toxic than hydrogen cyanide. In the following infographic, Alan’s Factory Outlet lists 38 radioactive elements and what they are used for.

Ultimate Online Slots Guide
The team at Deluxe Casino Bonus have put together this Ultimate Online Slots Guide, which discusses online slots in great detail. The infographic explains common online slots terminology, different types of symbols, games and a few tips on how to get the most out of your play.
B2B Content Marketing Stats, Trends and Budgets
B2B content marketing is necessary as it helps to outreach the global audience. As a marketer, one has to balance three elements in content marketing – engagement, relevance, and high quality. This helps the decision makers to execute the right action. A highly developed B2B content is the right key to increase sales and revenue.

How to Handle Unpaid Invoices and Preserve Cash Flow
The financial health is the backbone of every business and the strength of a business depends upon the cash flow. Check out this infographic from the team at Cogneesol to learn how to maintain positive cash flow by managing your unpaid invoices efficiently.
14 Common Coronavirus Myths Busted
As the Coronavirus epidemic continues to spread globally, social media posts and news articles concerning the outbreak are also surfacing. While everyone wants and needs to stay updated and informed about any progress made in curbing the disease, most of the people, unfortunately, fall prey to and rely on misleading or inaccurate information. They tend to believe in every piece of information that is thrown at them.
Virtual Workforce Statistics That Prove Remote Work Is The Future
Many companies have come to rely on the services of virtual assistants and freelancers since they are typically cheaper to have than office-based workers. A virtual workforce can handle a variety of tasks ranging from back-office work to standard office projects. One can say that remote work is the future, and this infographic looks at this in more detail.
Mental Health Under Quarantine
If you are stuck at home it’s important to remember you are healthy at home. Making distinctions like that are good for your mental health. Learn more from this infographic from Health Trends.

How to Get More Views on YouTube?
YouTube is a major source of fame for many brands and people around the world. It can help them gain clients and promote their status online. In fact, most persons are on the lookout for the best site to buy YouTube views. This helps them achieve success for their brand online. In this infographic, brand owners can find the best methods to opt-in for when the need to get YouTube views arises.
Maternal Cardiac Arrest is on the Rise
1 in 12,000 pregnant women in the US goes into sudden cardiac arrest and the trend is increasing. The good news is that they can be treated with CPR and defibrillation from an AED Machine. The bad news is that few people know of this issue and therefore respond to help women in need. Here is an infographic that shares the facts on maternal cardiac arrest and what you can do to help save lives.
Five Trend-Setting Jewelry Styles in 2020
When a new year draws to a close, many trends are shifting. Some of those improvements are the sense of style in jewelry. You may not fully change your look this 2020 but what you can do is to update it. To help you start with that, this infographic looks at the five best jewelry trends in 2020 that you can fit to your wardrobe.
38 Radioactive Elements and What They Are Used For
The radioactivity of an element depends on what isotope is present. Polonium-210 for example is regarded as an extremely volatile, dangerous, and radioactive isotope. By mass, polonium-210 is nearly 250,000 times more toxic than hydrogen cyanide. In the following infographic, Alan’s Factory Outlet lists 38 radioactive elements and what they are used for.
Ultimate Online Slots Guide
The team at Deluxe Casino Bonus have put together this Ultimate Online Slots Guide, which discusses online slots in great detail. The infographic explains common online slots terminology, different types of symbols, games and a few tips on how to get the most out of your play.
B2B Content Marketing Stats, Trends and Budgets
B2B content marketing is necessary as it helps to outreach the global audience. As a marketer, one has to balance three elements in content marketing – engagement, relevance, and high quality. This helps the decision makers to execute the right action. A highly developed B2B content is the right key to increase sales and revenue.
How to Handle Unpaid Invoices and Preserve Cash Flow
The financial health is the backbone of every business and the strength of a business depends upon the cash flow. Check out this infographic from the team at Cogneesol to learn how to maintain positive cash flow by managing your unpaid invoices efficiently.
14 Common Coronavirus Myths Busted
As the Coronavirus epidemic continues to spread globally, social media posts and news articles concerning the outbreak are also surfacing. While everyone wants and needs to stay updated and informed about any progress made in curbing the disease, most of the people, unfortunately, fall prey to and rely on misleading or inaccurate information. They tend to believe in every piece of information that is thrown at them.
Virtual Workforce Statistics That Prove Remote Work Is The Future
Many companies have come to rely on the services of virtual assistants and freelancers since they are typically cheaper to have than office-based workers. A virtual workforce can handle a variety of tasks ranging from back-office work to standard office projects. One can say that remote work is the future, and this infographic looks at this in more detail.
Mental Health Under Quarantine
If you are stuck at home it’s important to remember you are healthy at home. Making distinctions like that are good for your mental health. Learn more from this infographic from Health Trends.
How to Get More Views on YouTube?
YouTube is a major source of fame for many brands and people around the world. It can help them gain clients and promote their status online. In fact, most persons are on the lookout for the best site to buy YouTube views. This helps them achieve success for their brand online. In this infographic, brand owners can find the best methods to opt-in for when the need to get YouTube views arises.
Partners


Browse Archives By Category
Animated Infographics
Business Infographics
Career & Jobs Infographics
Education Infographics
Entertainment Industry Infographics
Environmental Infographics
Finance & Money Infographics
Food & Drink Infographics
Health Infographics
Historical Infographics
Home & Garden Infographics
Internet Infographics
Law and Legal Infographics
Lifestyle Infographics
Marketing Infographics
Offbeat Infographics
Parenting Infographics
Pets & Animals Infographics
Political Infographics
Shopping Infographics
Sports and Athletic Infographics
Technology Infographics
Transportation Infographics
Travel Infographics
Video Infographics