


Search 12,100+ Infographics!
The Pros and Cons of Red Dot Sights
Firefield’s guide to red sights compares the pros and cons of this popular accessory for guns that can improve accuracy in the right conditions. The team compiled all the greatest benefits and drawbacks of red sights in a detailed graphic that can help marksmen decide whether a red sight is right for them.
Which Saltwater Fish Are Caught the Most in the Atlantic Ocean?
Eager anglers head out for a fishing trip knowing there are some fish varieties they’re more likely to catch than others. The team at Staten Island Yachts presents the following infographic that shows Atlantic seaboard fishers what to expect when they head out on their next trip.
U.S. Counties With the Highest (and Lowest) Rates of Fatal Work Zone Traffic Accidents
When driving, work zones can be a real inconvenience. One minute you’re cruising along and the next, you’re stuck in traffic. You may see the reduced speed limits, closed lanes, orange signs, and traffic cones as annoyances delaying your journey, but the fact of the matter is that they are there to keep both you and the road workers safe.
Dangers of Wildlife to Livestock and Crops in the United States
The team at Pulsar illustrated the dangers posed by wildlife to crops and livestock with a chart that demonstrates key statistics describing the impact of species on crop yields and livestock herds. Feral hogs, in particular, are a major threat to humans, livestock, and crops alike.

Which Superheroes Have the Most Social Media Followers?
The team at PixlParade presents a dramatic superhero clash for the Internet Age. They calculated the number of followers for all the major superheroes from the prominent Marvel and DC franchises. The top six heroes all had over 10 million followers on social media, a number even the biggest influencers would envy.
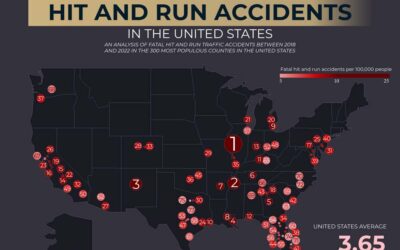
The 75 Deadliest Counties for Hit and Run Accidents in the United States
Where do most fatal hit and runs occur in the United States? About every 43 seconds in America, a fatal hit and run accident is happening, more often at night, often at a crosswalk, and sometimes ending in a fatality. But which cities and counties are the hotbeds of these crimes?

The Ultimate Guide to Special Forces Units Around the World
Across the world, elite warriors operate in the shadows, executing high-risk missions with unmatched skill and precision. This infographic offers a peek into this secretive realm of special forces, showcasing the world’s most formidable units—from the U.S. Navy SEALs to the British SAS and beyond.
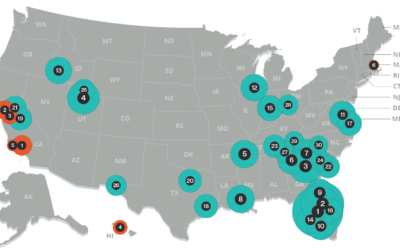
Which Cities Gained and Lost the Most Small Businesses in the Past Year?
Location can make or break a small business. The following infographic from Ooma demonstrates that fact with a map of the cities that saw the most new small businesses open last year, as well as those that lost the largest number of small businesses.

Common Guitar Maintenance Tips to Prolong Lifespan
Ensure your guitar stays in peak condition for years with help from the following infographic,. It outlines essential maintenance tips including regular string changes to preserve tone, proper fret board and body cleaning to prevent wear, ideal humidity control to avoid cracks, and truss rod adjustments for optimal action.

What Are the Best States for Car Enthusiasts?
The team at Speedway Motors set out to answer a burning question for car enthusiasts by creating a scoring system that determines the very best states for car lovers. To create their system, they examined the factors most important to car enthusiasts.
The Pros and Cons of Red Dot Sights
Firefield’s guide to red sights compares the pros and cons of this popular accessory for guns that can improve accuracy in the right conditions. The team compiled all the greatest benefits and drawbacks of red sights in a detailed graphic that can help marksmen decide whether a red sight is right for them.
Which Saltwater Fish Are Caught the Most in the Atlantic Ocean?
Eager anglers head out for a fishing trip knowing there are some fish varieties they’re more likely to catch than others. The team at Staten Island Yachts presents the following infographic that shows Atlantic seaboard fishers what to expect when they head out on their next trip.
U.S. Counties With the Highest (and Lowest) Rates of Fatal Work Zone Traffic Accidents
When driving, work zones can be a real inconvenience. One minute you’re cruising along and the next, you’re stuck in traffic. You may see the reduced speed limits, closed lanes, orange signs, and traffic cones as annoyances delaying your journey, but the fact of the matter is that they are there to keep both you and the road workers safe.
Dangers of Wildlife to Livestock and Crops in the United States
The team at Pulsar illustrated the dangers posed by wildlife to crops and livestock with a chart that demonstrates key statistics describing the impact of species on crop yields and livestock herds. Feral hogs, in particular, are a major threat to humans, livestock, and crops alike.
Which Superheroes Have the Most Social Media Followers?
The team at PixlParade presents a dramatic superhero clash for the Internet Age. They calculated the number of followers for all the major superheroes from the prominent Marvel and DC franchises. The top six heroes all had over 10 million followers on social media, a number even the biggest influencers would envy.
The 75 Deadliest Counties for Hit and Run Accidents in the United States
Where do most fatal hit and runs occur in the United States? About every 43 seconds in America, a fatal hit and run accident is happening, more often at night, often at a crosswalk, and sometimes ending in a fatality. But which cities and counties are the hotbeds of these crimes?
The Ultimate Guide to Special Forces Units Around the World
Across the world, elite warriors operate in the shadows, executing high-risk missions with unmatched skill and precision. This infographic offers a peek into this secretive realm of special forces, showcasing the world’s most formidable units—from the U.S. Navy SEALs to the British SAS and beyond.
Which Cities Gained and Lost the Most Small Businesses in the Past Year?
Location can make or break a small business. The following infographic from Ooma demonstrates that fact with a map of the cities that saw the most new small businesses open last year, as well as those that lost the largest number of small businesses.
Common Guitar Maintenance Tips to Prolong Lifespan
Ensure your guitar stays in peak condition for years with help from the following infographic,. It outlines essential maintenance tips including regular string changes to preserve tone, proper fret board and body cleaning to prevent wear, ideal humidity control to avoid cracks, and truss rod adjustments for optimal action.
What Are the Best States for Car Enthusiasts?
The team at Speedway Motors set out to answer a burning question for car enthusiasts by creating a scoring system that determines the very best states for car lovers. To create their system, they examined the factors most important to car enthusiasts.
Partners


Browse Archives By Category
Animated Infographics
Business Infographics
Career & Jobs Infographics
Education Infographics
Entertainment Industry Infographics
Environmental Infographics
Finance & Money Infographics
Food & Drink Infographics
Health Infographics
Historical Infographics
Home & Garden Infographics
Internet Infographics
Law and Legal Infographics
Lifestyle Infographics
Marketing Infographics
Offbeat Infographics
Parenting Infographics
Pets & Animals Infographics
Political Infographics
Shopping Infographics
Sports and Athletic Infographics
Technology Infographics
Transportation Infographics
Travel Infographics
Video Infographics