


Search 12,100+ Infographics!

Do’s and Don’ts for Your Wedding Photo-Shoot in Tagaytay
Just like wedding celebrations, your prenup photo-shoots demand a tedious amount of preparations. If you’re planning on having your prenup pictures taken in Tagaytay, you’re definitely up for a fun and exciting photo shoot! To keep you on the right track, here is an infographic that’ll give you a list of do’s and don’ts in making sure you’re well and ready for your prenup photo-shoot in Tagaytay.

A Guide to Coronavirus in the UK
Here is an infographic by the team at VizionOnline in London that is packed with information about the Coronavirus disease in the United Kingdom. It features the overall UK stats, total confirmed cases, confirmed cases by day, the top 20 worst hit areas in the UK and the main symptoms of Coronavirus from China along with advice from the NHS.

Fighting Coronavirus Disease: Take Precautions But Don’t Panic
On December 29, 2019, Chinese health authorities noticed an unusual cluster of pneumonia cases in the city of Wuhan, China, all linked to a new strain of the Coronavirus. By January 23, 2020, the sharp spike in number of cases in the Wuhan region prompted the Chinese government to announce a complete lock-down. This infographic looks at ways to fight the Coronavirus disease.

History’s Deadliest Viruses Illustrated to Scale
How does the Novel Coronavirus COVID-19 compare to the deadliest viruses our world has ever had to face? This infographic illustrates 24 of these deadly diseases to scale, including a chart that compares the mortality rate, death toll, mode of transmission, and more for these viruses that have wreaked so much havoc on our world.
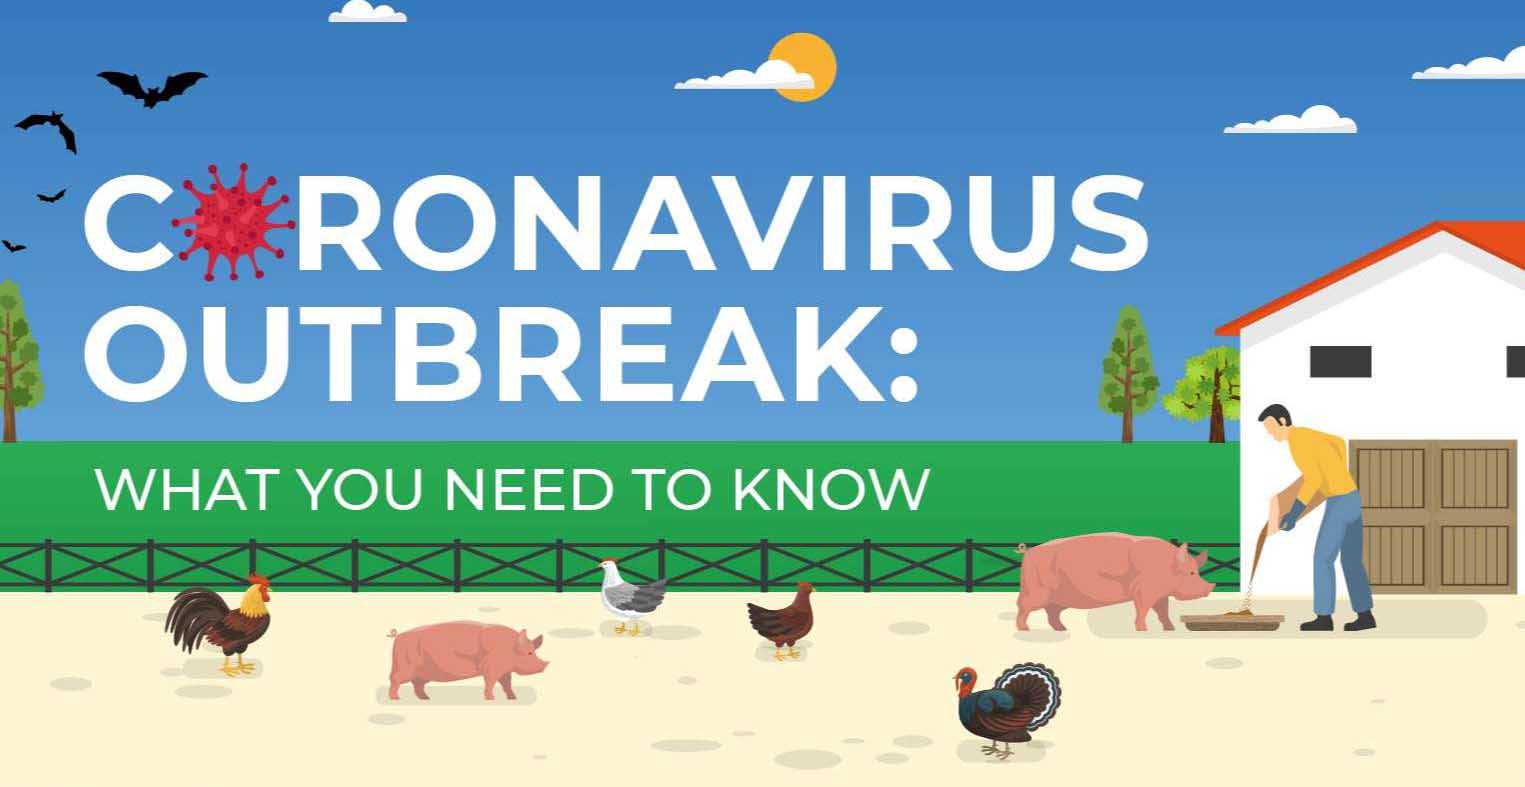
The Novel Coronavirus Outbreak: What You Need To Know
A new strain of Coronavirus has created panic around the globe. Here’s a short infographic, courtesy of Medanta, that includes everything you need to know about the Novel Coronavirus to stay informed and safe.

American Trucking Industry Statistics For 2020
The American trucking industry plays an important role in the American and world economy. The free flow of goods and services is critical to our economic success. The success of the trade agreement with China is promising and industry experts see signs of improved trucking income in the second half of 2020. American Freight has put together the following infographic which looks at American trucking industry statistics For 2020.

3 Easy Steps To Choose CBD Oil
CBD products are gaining popularity among consumers. Many people have been able to improve their quality of life thanks to various CBD offerings. Often, they will recommend these products to their relatives and friends. CBD manufacturers are responsive to the growing demand and are ready to offer a wide selection of CBD products in a variety of different forms. This is great, but when the buyer is trying to find the right CBD for what ails him, he needs guidance on what to look for.
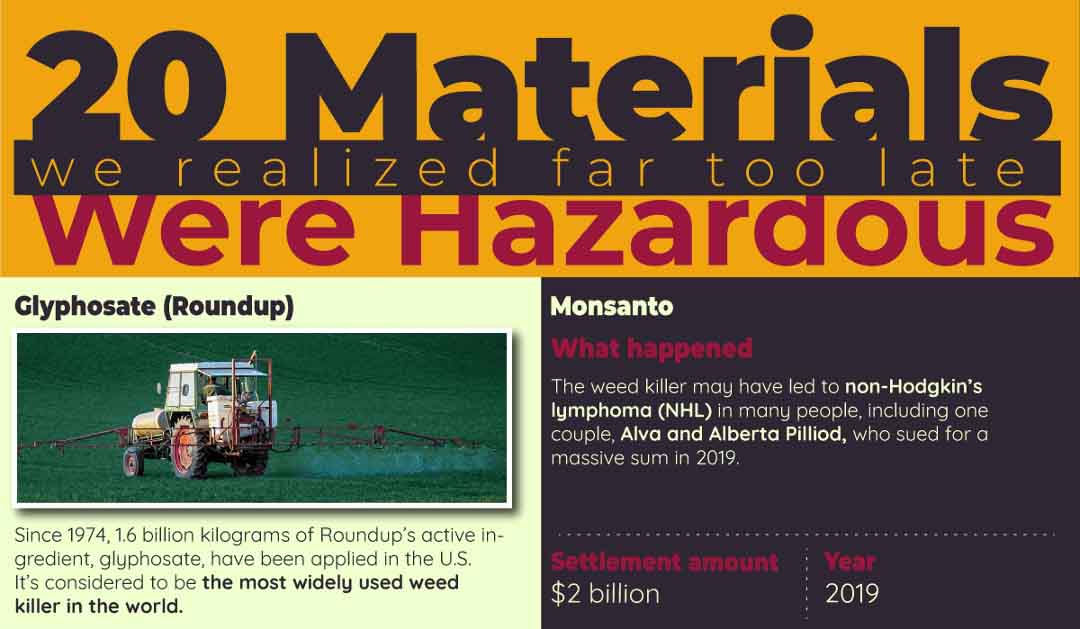
20 Materials We Realized Far Too Late Were Hazardous
From asbestos to tobacco to radium, hazardous products, materials, and chemicals are woven into history, endangering lives and the environment. These materials became available due to huge oversights in research, unpredictable outcomes, and often just gross negligence for the sake of profit. This infographic explores 20 materials that we realized far too late were so volatile and detrimental for health and nature.
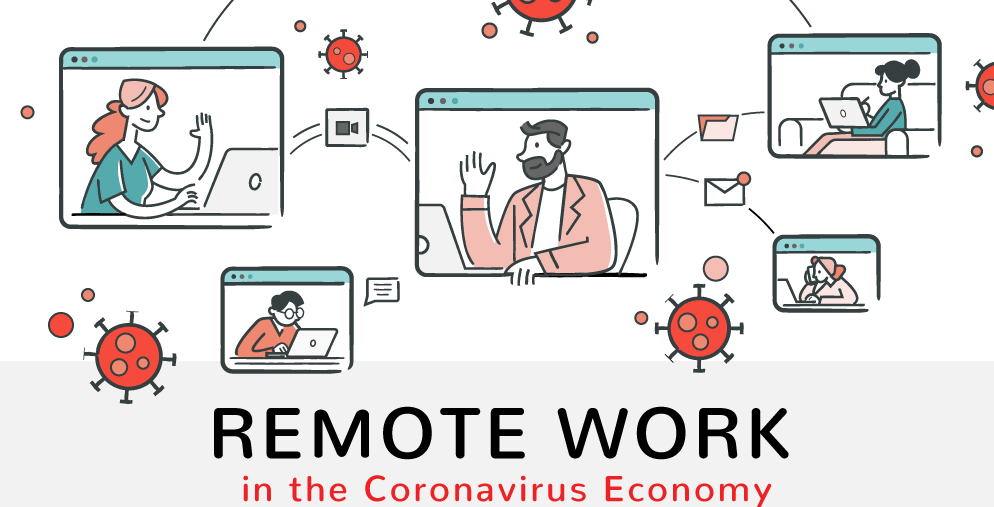
Remote Work in the Coronavirus Economy
Thanks to the rapid spread of COVID-19 people have started working remotely out of necessity, as more states order shelter-in-place protocols to fight the spread. With over 4 million plus people working from home, the Internet is allowing many of us to continue business as usual, with a few modifications. Check out the following infographic for a deep dive on the challenges, tech tips, and productivity of the new remote work economy.

The Science & Tech Behind Next-Gen Education
Technology provides a way to show students a wider range of opportunities, and in-class video use and EdTech chatbots seem to be doing wonders. BestEducationDegrees explains how the future of education will become more personalized by implementing technology. What will the classrooms of the future look like?
Do’s and Don’ts for Your Wedding Photo-Shoot in Tagaytay
Just like wedding celebrations, your prenup photo-shoots demand a tedious amount of preparations. If you’re planning on having your prenup pictures taken in Tagaytay, you’re definitely up for a fun and exciting photo shoot! To keep you on the right track, here is an infographic that’ll give you a list of do’s and don’ts in making sure you’re well and ready for your prenup photo-shoot in Tagaytay.
A Guide to Coronavirus in the UK
Here is an infographic by the team at VizionOnline in London that is packed with information about the Coronavirus disease in the United Kingdom. It features the overall UK stats, total confirmed cases, confirmed cases by day, the top 20 worst hit areas in the UK and the main symptoms of Coronavirus from China along with advice from the NHS.
Fighting Coronavirus Disease: Take Precautions But Don’t Panic
On December 29, 2019, Chinese health authorities noticed an unusual cluster of pneumonia cases in the city of Wuhan, China, all linked to a new strain of the Coronavirus. By January 23, 2020, the sharp spike in number of cases in the Wuhan region prompted the Chinese government to announce a complete lock-down. This infographic looks at ways to fight the Coronavirus disease.
History’s Deadliest Viruses Illustrated to Scale
How does the Novel Coronavirus COVID-19 compare to the deadliest viruses our world has ever had to face? This infographic illustrates 24 of these deadly diseases to scale, including a chart that compares the mortality rate, death toll, mode of transmission, and more for these viruses that have wreaked so much havoc on our world.
The Novel Coronavirus Outbreak: What You Need To Know
A new strain of Coronavirus has created panic around the globe. Here’s a short infographic, courtesy of Medanta, that includes everything you need to know about the Novel Coronavirus to stay informed and safe.
American Trucking Industry Statistics For 2020
The American trucking industry plays an important role in the American and world economy. The free flow of goods and services is critical to our economic success. The success of the trade agreement with China is promising and industry experts see signs of improved trucking income in the second half of 2020. American Freight has put together the following infographic which looks at American trucking industry statistics For 2020.
3 Easy Steps To Choose CBD Oil
CBD products are gaining popularity among consumers. Many people have been able to improve their quality of life thanks to various CBD offerings. Often, they will recommend these products to their relatives and friends. CBD manufacturers are responsive to the growing demand and are ready to offer a wide selection of CBD products in a variety of different forms. This is great, but when the buyer is trying to find the right CBD for what ails him, he needs guidance on what to look for.
20 Materials We Realized Far Too Late Were Hazardous
From asbestos to tobacco to radium, hazardous products, materials, and chemicals are woven into history, endangering lives and the environment. These materials became available due to huge oversights in research, unpredictable outcomes, and often just gross negligence for the sake of profit. This infographic explores 20 materials that we realized far too late were so volatile and detrimental for health and nature.
Remote Work in the Coronavirus Economy
Thanks to the rapid spread of COVID-19 people have started working remotely out of necessity, as more states order shelter-in-place protocols to fight the spread. With over 4 million plus people working from home, the Internet is allowing many of us to continue business as usual, with a few modifications. Check out the following infographic for a deep dive on the challenges, tech tips, and productivity of the new remote work economy.
The Science & Tech Behind Next-Gen Education
Technology provides a way to show students a wider range of opportunities, and in-class video use and EdTech chatbots seem to be doing wonders. BestEducationDegrees explains how the future of education will become more personalized by implementing technology. What will the classrooms of the future look like?
Partners


Browse Archives By Category
Animated Infographics
Business Infographics
Career & Jobs Infographics
Education Infographics
Entertainment Industry Infographics
Environmental Infographics
Finance & Money Infographics
Food & Drink Infographics
Health Infographics
Historical Infographics
Home & Garden Infographics
Internet Infographics
Law and Legal Infographics
Lifestyle Infographics
Marketing Infographics
Offbeat Infographics
Parenting Infographics
Pets & Animals Infographics
Political Infographics
Shopping Infographics
Sports and Athletic Infographics
Technology Infographics
Transportation Infographics
Travel Infographics
Video Infographics