


Search 12,100+ Infographics!

13 Corsage Flower Ideas for Your Prom Night
As the prom season approaches, you are probably looking forward to the special night. In preparing for the event, you might have already made a long list of to-do items – from choosing the best attire that would earn you the “Prom Queen” title, searching for various hair and makeup inspiration online, practicing the dance, and even down to finding the perfect corsage.
Alternative Energy Sources To Power Your Car
Whether you’re interested in green energy or are considering buying an alternative-powered car further down the line, the team at CarRentals recently published their ranking of the most promising alternative energy sources. This includes the most comm sources like electric/battery, biodiesel and hydrogen cell fuel to more intriguing ideas like sewage, coffee, and chocolate.

How To Get More Followers On Instagram in 2020
Buying Instagram followers is hardly a new thing. Many successful and popular brands sometimes choose to buy new followers instead of trying to attract them for months and years. Many online companies are offering various packages at a reasonable price, for fast-forward promotions and similar events. If big names are doing it then it’s probably safe to say that it can be useful for small businesses and individuals as well.

The Top Skills to Learn to Defend Against Automation
Automation is coming whether workers want it to or not, and the best line of defense against it is learning the skills that are the hardest to automate. This infographic courtesy of Grey Campus takes an in depth look into the skills that will be the most necessary to have in the future, and the professions that are at the lowest-risk of being automated.

Is London the Hacking Capital of the World?
London has left its own mark as a worldwide center of technology, but recent reports demonstrate that the UK’s financial center has also turned into a center for cyber-crime. An infographic made by EC-MSP presents the extent of the newest cyber threats. With information breaches and cyber attacks becoming the world’s costliest offenses, London organisations are advised to improve their safety procedures.
Which Superhero Would Make the Best Guarantor For a Loan?
This infographic focuses on various characters from the Avengers and whether they would or wouldn’t be suitable as a Guarantor on a loan. A large percentage of Guarantor Loan applicants are below the age of 35, so the guys at Solution Loans thought it would be a good way to get people to think more carefully about whether a Guarantor Loan is right for them.

eSIM Market in 2025: Trends & Insights
The eSIM industry is exploding, made evident in a report from March 2020 by the Global System for Mobile Communications Association (GSMA) who oversee eSIM specification and standards. Detailing the responses of over 100 mobile phone operators to a smartphone survey, the report examined the implications of a rapid rise in eSIM connections for all eSIM stakeholders.
Best Car Scene Movie Moments
A study of 2,000 film fans by Jardine Motors Group has revealed the Mini chase in the Italian Job is the best car movie scene of all time. The memorable six-minute-long scene, with the three iconic Mini models being pursued by police, rolling down stairs and even scaling buildings, topped the poll.
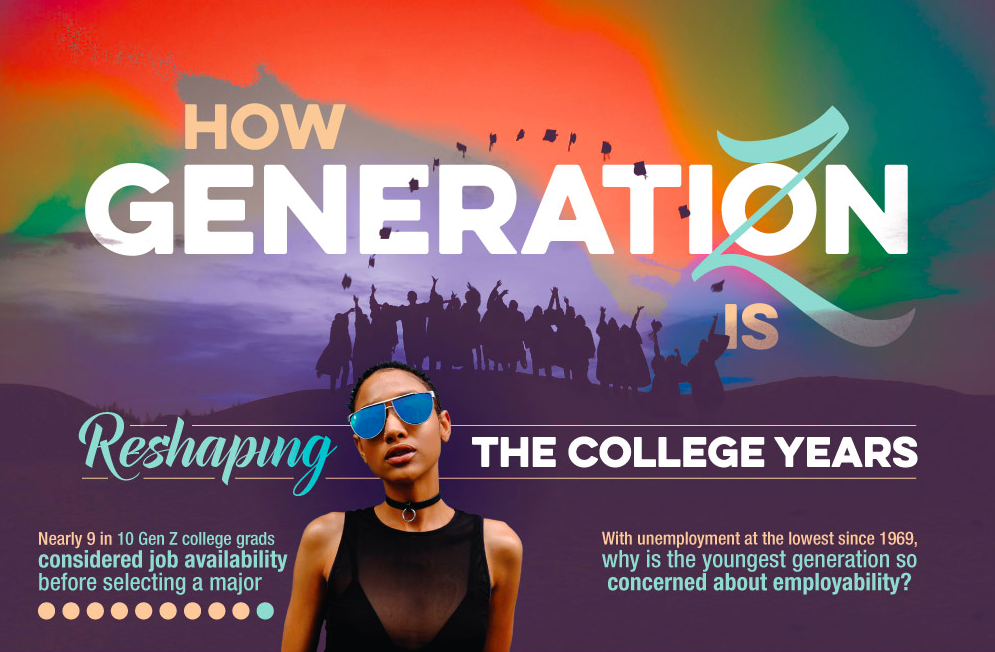
How Gen Z Is Reshaping The College Years
For Gen Z, it’s all about employment, but unemployment numbers don’t tell the whole story. In the following infographic, OnlineCollegePlan explains how Gen Z is doing college differently. Will Gen Z’s bet on education pay off?
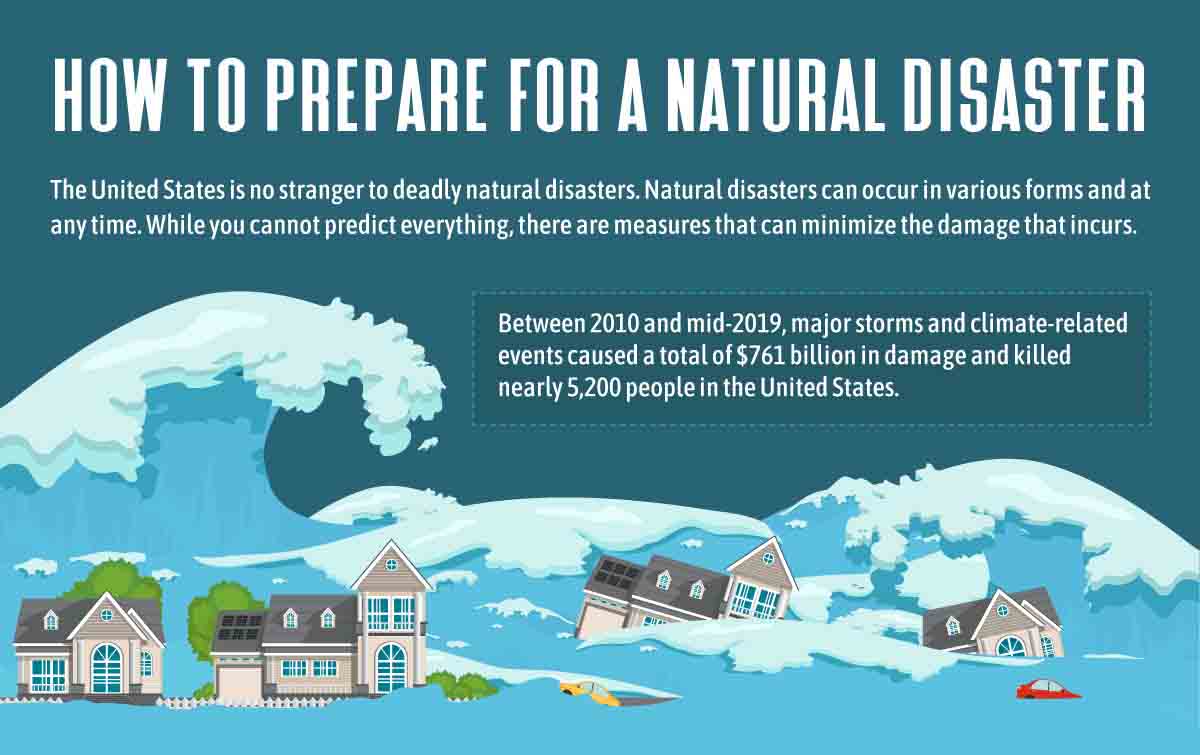
How To Prepare for a Natural Disaster
Mother nature has several forms, and sometimes it shows it’s brutal side. The United States is no stranger to deadly natural disasters. The USA has faced many severe natural disasters, from churning hurricanes of the gulf coast to the trailer-tossing storms of tornado alley, to the ground-pounding quakes of California. For detailed information on how to prepare for a natural disaster, check out the following infographic.
13 Corsage Flower Ideas for Your Prom Night
As the prom season approaches, you are probably looking forward to the special night. In preparing for the event, you might have already made a long list of to-do items – from choosing the best attire that would earn you the “Prom Queen” title, searching for various hair and makeup inspiration online, practicing the dance, and even down to finding the perfect corsage.
Alternative Energy Sources To Power Your Car
Whether you’re interested in green energy or are considering buying an alternative-powered car further down the line, the team at CarRentals recently published their ranking of the most promising alternative energy sources. This includes the most comm sources like electric/battery, biodiesel and hydrogen cell fuel to more intriguing ideas like sewage, coffee, and chocolate.
How To Get More Followers On Instagram in 2020
Buying Instagram followers is hardly a new thing. Many successful and popular brands sometimes choose to buy new followers instead of trying to attract them for months and years. Many online companies are offering various packages at a reasonable price, for fast-forward promotions and similar events. If big names are doing it then it’s probably safe to say that it can be useful for small businesses and individuals as well.
The Top Skills to Learn to Defend Against Automation
Automation is coming whether workers want it to or not, and the best line of defense against it is learning the skills that are the hardest to automate. This infographic courtesy of Grey Campus takes an in depth look into the skills that will be the most necessary to have in the future, and the professions that are at the lowest-risk of being automated.
Is London the Hacking Capital of the World?
London has left its own mark as a worldwide center of technology, but recent reports demonstrate that the UK’s financial center has also turned into a center for cyber-crime. An infographic made by EC-MSP presents the extent of the newest cyber threats. With information breaches and cyber attacks becoming the world’s costliest offenses, London organisations are advised to improve their safety procedures.
Which Superhero Would Make the Best Guarantor For a Loan?
This infographic focuses on various characters from the Avengers and whether they would or wouldn’t be suitable as a Guarantor on a loan. A large percentage of Guarantor Loan applicants are below the age of 35, so the guys at Solution Loans thought it would be a good way to get people to think more carefully about whether a Guarantor Loan is right for them.
eSIM Market in 2025: Trends & Insights
The eSIM industry is exploding, made evident in a report from March 2020 by the Global System for Mobile Communications Association (GSMA) who oversee eSIM specification and standards. Detailing the responses of over 100 mobile phone operators to a smartphone survey, the report examined the implications of a rapid rise in eSIM connections for all eSIM stakeholders.
Best Car Scene Movie Moments
A study of 2,000 film fans by Jardine Motors Group has revealed the Mini chase in the Italian Job is the best car movie scene of all time. The memorable six-minute-long scene, with the three iconic Mini models being pursued by police, rolling down stairs and even scaling buildings, topped the poll.
How Gen Z Is Reshaping The College Years
For Gen Z, it’s all about employment, but unemployment numbers don’t tell the whole story. In the following infographic, OnlineCollegePlan explains how Gen Z is doing college differently. Will Gen Z’s bet on education pay off?
How To Prepare for a Natural Disaster
Mother nature has several forms, and sometimes it shows it’s brutal side. The United States is no stranger to deadly natural disasters. The USA has faced many severe natural disasters, from churning hurricanes of the gulf coast to the trailer-tossing storms of tornado alley, to the ground-pounding quakes of California. For detailed information on how to prepare for a natural disaster, check out the following infographic.
Partners


Browse Archives By Category
Animated Infographics
Business Infographics
Career & Jobs Infographics
Education Infographics
Entertainment Industry Infographics
Environmental Infographics
Finance & Money Infographics
Food & Drink Infographics
Health Infographics
Historical Infographics
Home & Garden Infographics
Internet Infographics
Law and Legal Infographics
Lifestyle Infographics
Marketing Infographics
Offbeat Infographics
Parenting Infographics
Pets & Animals Infographics
Political Infographics
Shopping Infographics
Sports and Athletic Infographics
Technology Infographics
Transportation Infographics
Travel Infographics
Video Infographics