


Search 12,100+ Infographics!
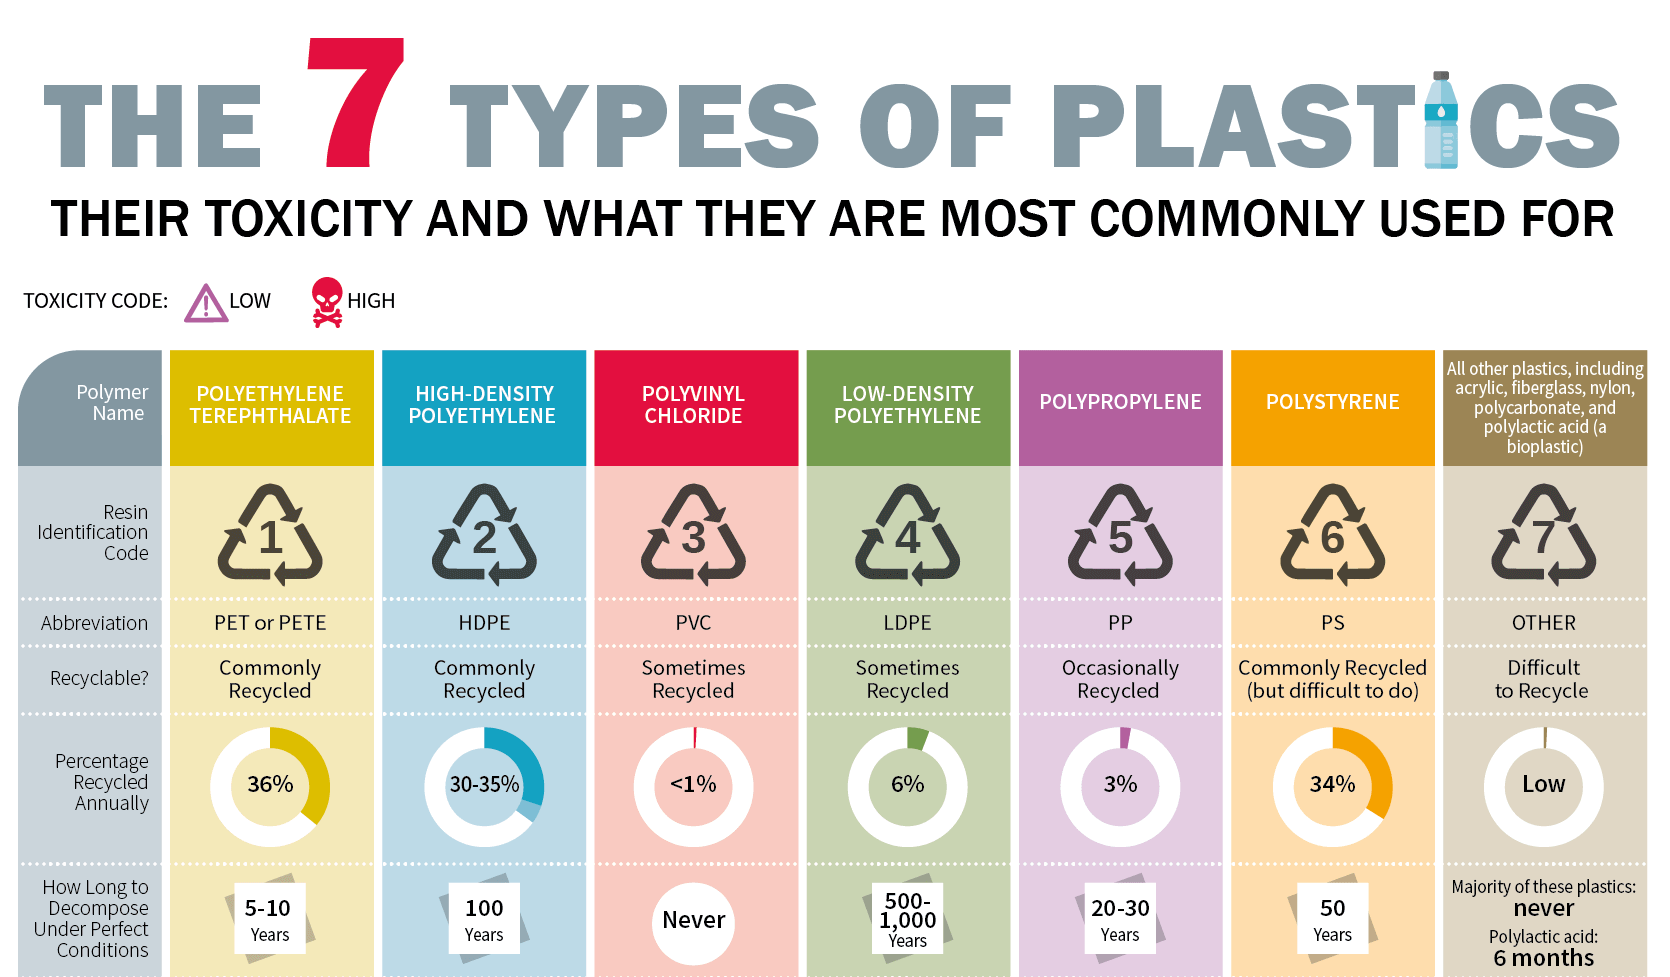
7 Types of Plastics: Their Toxicity & What They’re Most Commonly Used For
Plastic is used to create many of the products we use every single day, from the containers our food and medicine is packaged in to eyeglasses, toys, car parts, and household materials. But with plastic toxicity becoming a rising concern, how safe are the plastic products we’re constantly using? Here is a chart explores the many products that are commonly made from the seven different types of plastics and the properties that differentiate them.
Technologicalization – Technology Trends to Watch in 2020
Technology is a vast and ever-evolving root term. With changing times it has taken a step forward in nearly every aspect of our lives. It’s now on the cusp of moving ahead of augmentation and in the future, it may replace human capability into augmentation that creates superhuman capability.
How Much Do Americans Drive?
The US Department of Transportation has released data that shows that the average American drives more than 1,000 miles per month and up to a whopping 13,474 miles each year. But there’s a significant difference when it comes to gender, with the average male driver recording 16,550 miles each year and the average female driver 10,142 miles or 63% less.
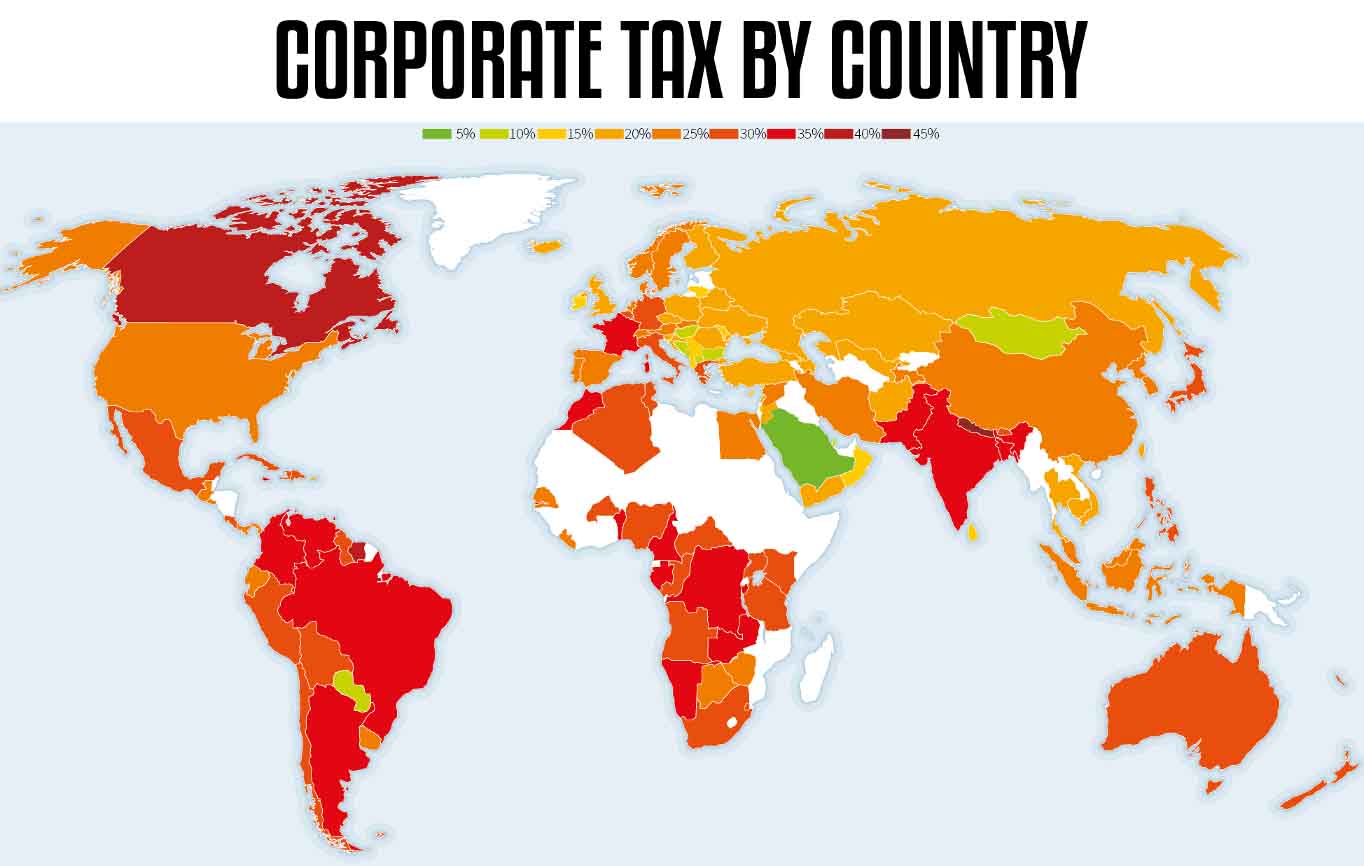
Corporate Tax by Country Around the World
There have been big changes in the tax code in the United States over the past few years. These changes have impacted just about everyone in the country, from regular families to huge corporations. Have you ever wondered how the corporate tax rate in the U.S. compares to other countries around the world? Which countries have a higher tax rate? Check out this infographic to see which countries have the highest (and lowest) corporate tax rates around the world.

5 Things You Can Do Around the Home to Help the Environment
In recent years, what was previously referred to as climate change is now often being referred to as ‘the climate crisis’. This indicates that environmental concerns are more pressing than ever before. Many people want to take action, but helping the environment can seem overwhelming. It is hard to know where to begin, but changing behavior at home can be the best place to start.

React Vs Angular Vs Vue
In the following infographic, Bacancy Technology has put together a visual comparison between most popular front-end frameworks React, Angular, and Vue, based on performance, popularity, learning curve, community, flexibility & size.

How Pigs Helped Trump Win the Trade War
This infographic from the team at Pigly helps explain how President Trump aimed to fight the United States trade imbalance with China and how pigs helped Trump gain the upper hand as African Swine Fever caused food price inflation across China.
The Science of Love: A Happy Relationship Cheat Sheet
To commemorate Valentine’s Day, here is an infographic that breaks down the science of love. Using findings and data from recent scientific studies, they outline the key habits of happy, healthy and loving relationships. If you want more science-based guidance into the habits of happy couples, check out this epic cheat sheet below.
Florida DUI Statistics
Every time we enter an automobile, we’re putting ourselves at risk of injury or even death. According to the National Safety Council, car accidents are so frequently dangerous that there is a 1 in 114 chance that a person will sustain serious injuries from a car accident. For example, in 2017 there were 5,125 alcohol-related car crashes in Florida. In this infographic, learn all about Florida DUI Statistics and the dangers of drinking and driving.
Environmental Issues Faced by Americans
All the living things on the planet depends on a clean and healthy environment for enhanced survival opportunities. However, we are facing a significant fall in environmental quality. Apart from the CO2 emission, the USA is facing soil pollution, air pollution, water pollution, garbage disposal, global warming, deforestation, acidification of ocean water, ozone layer depletion, radioactive contamination, mine pollution, overpopulation, and nano pollution.
7 Types of Plastics: Their Toxicity & What They’re Most Commonly Used For
Plastic is used to create many of the products we use every single day, from the containers our food and medicine is packaged in to eyeglasses, toys, car parts, and household materials. But with plastic toxicity becoming a rising concern, how safe are the plastic products we’re constantly using? Here is a chart explores the many products that are commonly made from the seven different types of plastics and the properties that differentiate them.
Technologicalization – Technology Trends to Watch in 2020
Technology is a vast and ever-evolving root term. With changing times it has taken a step forward in nearly every aspect of our lives. It’s now on the cusp of moving ahead of augmentation and in the future, it may replace human capability into augmentation that creates superhuman capability.
How Much Do Americans Drive?
The US Department of Transportation has released data that shows that the average American drives more than 1,000 miles per month and up to a whopping 13,474 miles each year. But there’s a significant difference when it comes to gender, with the average male driver recording 16,550 miles each year and the average female driver 10,142 miles or 63% less.
Corporate Tax by Country Around the World
There have been big changes in the tax code in the United States over the past few years. These changes have impacted just about everyone in the country, from regular families to huge corporations. Have you ever wondered how the corporate tax rate in the U.S. compares to other countries around the world? Which countries have a higher tax rate? Check out this infographic to see which countries have the highest (and lowest) corporate tax rates around the world.
5 Things You Can Do Around the Home to Help the Environment
In recent years, what was previously referred to as climate change is now often being referred to as ‘the climate crisis’. This indicates that environmental concerns are more pressing than ever before. Many people want to take action, but helping the environment can seem overwhelming. It is hard to know where to begin, but changing behavior at home can be the best place to start.
React Vs Angular Vs Vue
In the following infographic, Bacancy Technology has put together a visual comparison between most popular front-end frameworks React, Angular, and Vue, based on performance, popularity, learning curve, community, flexibility & size.
How Pigs Helped Trump Win the Trade War
This infographic from the team at Pigly helps explain how President Trump aimed to fight the United States trade imbalance with China and how pigs helped Trump gain the upper hand as African Swine Fever caused food price inflation across China.
The Science of Love: A Happy Relationship Cheat Sheet
To commemorate Valentine’s Day, here is an infographic that breaks down the science of love. Using findings and data from recent scientific studies, they outline the key habits of happy, healthy and loving relationships. If you want more science-based guidance into the habits of happy couples, check out this epic cheat sheet below.
Florida DUI Statistics
Every time we enter an automobile, we’re putting ourselves at risk of injury or even death. According to the National Safety Council, car accidents are so frequently dangerous that there is a 1 in 114 chance that a person will sustain serious injuries from a car accident. For example, in 2017 there were 5,125 alcohol-related car crashes in Florida. In this infographic, learn all about Florida DUI Statistics and the dangers of drinking and driving.
Environmental Issues Faced by Americans
All the living things on the planet depends on a clean and healthy environment for enhanced survival opportunities. However, we are facing a significant fall in environmental quality. Apart from the CO2 emission, the USA is facing soil pollution, air pollution, water pollution, garbage disposal, global warming, deforestation, acidification of ocean water, ozone layer depletion, radioactive contamination, mine pollution, overpopulation, and nano pollution.
Partners


Browse Archives By Category
Animated Infographics
Business Infographics
Career & Jobs Infographics
Education Infographics
Entertainment Industry Infographics
Environmental Infographics
Finance & Money Infographics
Food & Drink Infographics
Health Infographics
Historical Infographics
Home & Garden Infographics
Internet Infographics
Law and Legal Infographics
Lifestyle Infographics
Marketing Infographics
Offbeat Infographics
Parenting Infographics
Pets & Animals Infographics
Political Infographics
Shopping Infographics
Sports and Athletic Infographics
Technology Infographics
Transportation Infographics
Travel Infographics
Video Infographics