


Search 12,100+ Infographics!
The Hidden Meanings and Symbolism of 50 Iconic Brand Logos
Today, logos have become more sophisticated, compelling, and powerful. Even if they appear minimalist, the meanings and emotions evoked by branding are painstakingly orchestrated. The angles, colors, and fonts are chosen carefully. Even the lack of pixels can elevate a logo, considering how much branding can rely on negative space. This infographic explores the hidden meanings and stories behind 50 iconic logo designs.

How to Choose a Sewing Machine?
If you are new to sewing, how do you choose the correct sewing machine? Here is an infographic that points out 3 things to consider including weight, stitch selection and does it sew well.

How to Choose the Microphone That Perfectly Suits You
You can be a professional singer, a reporter, an interviewer, a karaoke lover, a podcast maker, and many other things that require the use of a microphone. Each individual voice can sound different depending on the mic you choose. The problem is often how to make the right choice. In the following infographic, explore a number of guidelines that are better to be taken into consideration.
Digital Marketing Predictions For 2020
As the internet has become the backbone of everything, the importance of digital media cannot be denied. Creating a website or running some unfocused advertisement campaign is no longer enough for the growth of the business unless you have some extraordinary digital marketing strategy for your business. In the following infographic, look at some digital marketing predictions For 2020.

How to Build a Hurricane Resistant Home
America is a hurricane-active region and has faced many devastating hurricanes in recent years. In 2017, Hurricane Maria destroyed the United States territory of Puerto Rico, taking the lives of over 2,900 locals. The storm killed the power supply of the island and destroyed thousands of residential, commercial, and industrial buildings.

Why & How to Get Rid of Useless Apps
Today there are so many amazing apps that it is quite easy to get confused about which ones you really need. Unscrupulous developers are trying to make you download their software that not only brings you no good but also makes your device work less efficiently. In this infographic, Apppearl looks at the why and how to get rid of useless apps.

Beginner’s Guide To Growing Weed Indoors
Curious about how to grow weed for the first time? There is plenty of information out there about how to grow marijuana, but weeding through all the marijuana growing tips – pun intended – can be exhausting. This growers guide and infographic will teach you how to grow weed indoors so that you can become a pro in no time.

The Business of Post-Acute Care
By 2026, the market for long term care in the U.S. will reach more than $737 billion. Yet, nursing homes have faced increasing closures over the 2 decades. Why are costs rising, and what’s missing in leadership? The following infographic explains the operational factors shaping the post-acute ecosystem.
Maintaining Fuel: Behind the Scenes in Different Industries
With 9 million gallons of fuel being used in the US every day, it is easy to see why the fuel industry is such a big business. In the following infographic, learn about the behind the scenes of maintaining fuel so the next time you’re filling up your tank or riding in an airplane, you’ll have a little more information about one-third of the world’s energy supply.

The People & Tech Behind Data Science
Data scientists use heterogeneous data to solve complex problems. With skills in mathematics and computer science, anyone can be a data scientist. Explaining more on the topic, Noodle.ai outlines why it’s cool to be a data scientist, and how the AI software and tech they create can change the world.
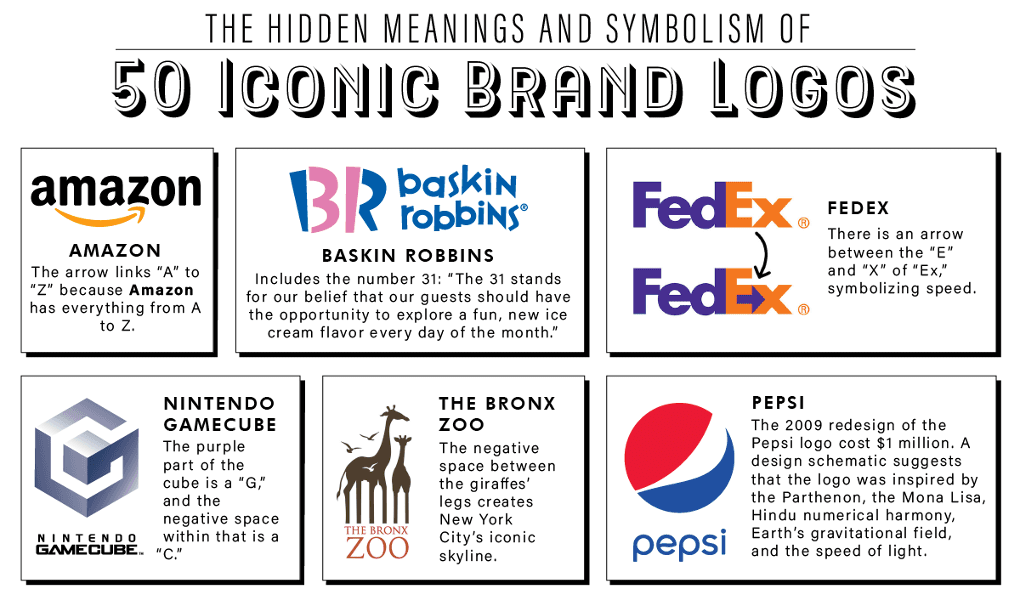
The Hidden Meanings and Symbolism of 50 Iconic Brand Logos
Today, logos have become more sophisticated, compelling, and powerful. Even if they appear minimalist, the meanings and emotions evoked by branding are painstakingly orchestrated. The angles, colors, and fonts are chosen carefully. Even the lack of pixels can elevate a logo, considering how much branding can rely on negative space. This infographic explores the hidden meanings and stories behind 50 iconic logo designs.
How to Choose a Sewing Machine?
If you are new to sewing, how do you choose the correct sewing machine? Here is an infographic that points out 3 things to consider including weight, stitch selection and does it sew well.
How to Choose the Microphone That Perfectly Suits You
You can be a professional singer, a reporter, an interviewer, a karaoke lover, a podcast maker, and many other things that require the use of a microphone. Each individual voice can sound different depending on the mic you choose. The problem is often how to make the right choice. In the following infographic, explore a number of guidelines that are better to be taken into consideration.
Digital Marketing Predictions For 2020
As the internet has become the backbone of everything, the importance of digital media cannot be denied. Creating a website or running some unfocused advertisement campaign is no longer enough for the growth of the business unless you have some extraordinary digital marketing strategy for your business. In the following infographic, look at some digital marketing predictions For 2020.
How to Build a Hurricane Resistant Home
America is a hurricane-active region and has faced many devastating hurricanes in recent years. In 2017, Hurricane Maria destroyed the United States territory of Puerto Rico, taking the lives of over 2,900 locals. The storm killed the power supply of the island and destroyed thousands of residential, commercial, and industrial buildings.
Why & How to Get Rid of Useless Apps
Today there are so many amazing apps that it is quite easy to get confused about which ones you really need. Unscrupulous developers are trying to make you download their software that not only brings you no good but also makes your device work less efficiently. In this infographic, Apppearl looks at the why and how to get rid of useless apps.
Beginner’s Guide To Growing Weed Indoors
Curious about how to grow weed for the first time? There is plenty of information out there about how to grow marijuana, but weeding through all the marijuana growing tips – pun intended – can be exhausting. This growers guide and infographic will teach you how to grow weed indoors so that you can become a pro in no time.
The Business of Post-Acute Care
By 2026, the market for long term care in the U.S. will reach more than $737 billion. Yet, nursing homes have faced increasing closures over the 2 decades. Why are costs rising, and what’s missing in leadership? The following infographic explains the operational factors shaping the post-acute ecosystem.
Maintaining Fuel: Behind the Scenes in Different Industries
With 9 million gallons of fuel being used in the US every day, it is easy to see why the fuel industry is such a big business. In the following infographic, learn about the behind the scenes of maintaining fuel so the next time you’re filling up your tank or riding in an airplane, you’ll have a little more information about one-third of the world’s energy supply.
The People & Tech Behind Data Science
Data scientists use heterogeneous data to solve complex problems. With skills in mathematics and computer science, anyone can be a data scientist. Explaining more on the topic, Noodle.ai outlines why it’s cool to be a data scientist, and how the AI software and tech they create can change the world.
Partners


Browse Archives By Category
Animated Infographics
Business Infographics
Career & Jobs Infographics
Education Infographics
Entertainment Industry Infographics
Environmental Infographics
Finance & Money Infographics
Food & Drink Infographics
Health Infographics
Historical Infographics
Home & Garden Infographics
Internet Infographics
Law and Legal Infographics
Lifestyle Infographics
Marketing Infographics
Offbeat Infographics
Parenting Infographics
Pets & Animals Infographics
Political Infographics
Shopping Infographics
Sports and Athletic Infographics
Technology Infographics
Transportation Infographics
Travel Infographics
Video Infographics