


Search 12,100+ Infographics!

How to Earn an MS in Software Development
Did you know that you can earn an MS in Software Development in only 10 months? Learn how to get this game changer for your career in the following infographic.

Choosing the Right App Development Partner
If you’re still unsure about which option is best for your long-term business goals, don’t worry, you’re in good company. Learn more about how you can choose the right mobile app development partner with confidence in the following infographic.
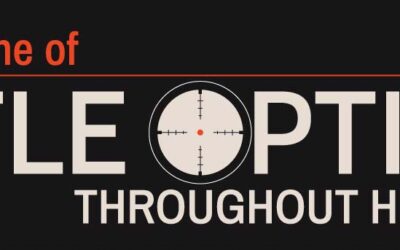
A Timeline of Rifle Optics Throughout History
Optics technology has revolutionized the rifle. The team at Firefield charted the evolution of rifle optics with a fascinating illustrated timeline that showcases the most pivotal developments that led to today’s night-vision and high-optics models.
30 Self-Employment Statistics
Self-employment is an alternative career path that offers its own benefits and complications. Here are thirty facts and statistics about self-employment reveal the prevalence of this work style, its unique benefits and challenges, and the attitudes of workers toward self-employment.

The Most Iconic Uses of Thermal Optics in Fiction
Thermal optics technology is pervasive in film, whether it appears on-screen, as a fictional example, or is an integral part of the filmmaking process. There are many examples of real-life thermal optics tech used by fictional characters in films. We mainly see it in military movies.

The 25 U.S. Counties Where the Most Children Are Living in Poverty
The team at PA Requirements highlights a significant social issue with a map of U.S. areas that have the highest percentage of children living in poverty. Childhood poverty can have life-long adverse effects. If we want to live in a more equitable society with safer, happier, healthier children, this is an issue that must be addressed.
ETL (Extraction, Transformation, Loading) Explained
Businesses generate massive amounts of information, yet only a fraction of it is analyzed. Studies show that companies review just 37% to 40% of their internal data, leaving valuable insights untapped. To bridge this gap, organizations invest in ETL solutions.
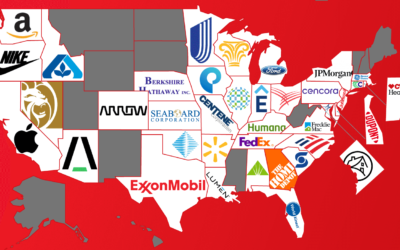
The Biggest Fortune 500 Company in Every State
The Fortune 500 list features the most profitable companies in the United States, ranked by revenue from the latest fiscal year. Companies must be publicly traded to be included, and securing a spot on the list is prestigious. The Chartistry team offers a fresh perspective by highlighting the largest Fortune 500 companies in each state.

The Highest Grossing Movies by Genre
In Hollywood, a film’s success is often measured by its box office earnings. While awards and artistic recognition are important, producers ultimately want their films to succeed financially. The team at Theater Seat Store has compiled a list of the biggest blockbusters of all time, categorized by genre, based on their box office gross.
How Will AI Impact the Film Industry?
The Theater Seat Store team looked at the impact of AI on the film industry. Many people are only aware of the potential dangers of AI because of famous films like the Terminator series and Metropolis. But computers have also played a massive part in creating the movies we love.
How to Earn an MS in Software Development
Did you know that you can earn an MS in Software Development in only 10 months? Learn how to get this game changer for your career in the following infographic.
Choosing the Right App Development Partner
If you’re still unsure about which option is best for your long-term business goals, don’t worry, you’re in good company. Learn more about how you can choose the right mobile app development partner with confidence in the following infographic.
A Timeline of Rifle Optics Throughout History
Optics technology has revolutionized the rifle. The team at Firefield charted the evolution of rifle optics with a fascinating illustrated timeline that showcases the most pivotal developments that led to today’s night-vision and high-optics models.
30 Self-Employment Statistics
Self-employment is an alternative career path that offers its own benefits and complications. Here are thirty facts and statistics about self-employment reveal the prevalence of this work style, its unique benefits and challenges, and the attitudes of workers toward self-employment.
The Most Iconic Uses of Thermal Optics in Fiction
Thermal optics technology is pervasive in film, whether it appears on-screen, as a fictional example, or is an integral part of the filmmaking process. There are many examples of real-life thermal optics tech used by fictional characters in films. We mainly see it in military movies.
The 25 U.S. Counties Where the Most Children Are Living in Poverty
The team at PA Requirements highlights a significant social issue with a map of U.S. areas that have the highest percentage of children living in poverty. Childhood poverty can have life-long adverse effects. If we want to live in a more equitable society with safer, happier, healthier children, this is an issue that must be addressed.
ETL (Extraction, Transformation, Loading) Explained
Businesses generate massive amounts of information, yet only a fraction of it is analyzed. Studies show that companies review just 37% to 40% of their internal data, leaving valuable insights untapped. To bridge this gap, organizations invest in ETL solutions.
The Biggest Fortune 500 Company in Every State
The Fortune 500 list features the most profitable companies in the United States, ranked by revenue from the latest fiscal year. Companies must be publicly traded to be included, and securing a spot on the list is prestigious. The Chartistry team offers a fresh perspective by highlighting the largest Fortune 500 companies in each state.
The Highest Grossing Movies by Genre
In Hollywood, a film’s success is often measured by its box office earnings. While awards and artistic recognition are important, producers ultimately want their films to succeed financially. The team at Theater Seat Store has compiled a list of the biggest blockbusters of all time, categorized by genre, based on their box office gross.
How Will AI Impact the Film Industry?
The Theater Seat Store team looked at the impact of AI on the film industry. Many people are only aware of the potential dangers of AI because of famous films like the Terminator series and Metropolis. But computers have also played a massive part in creating the movies we love.
Partners


Browse Archives By Category
Animated Infographics
Business Infographics
Career & Jobs Infographics
Education Infographics
Entertainment Industry Infographics
Environmental Infographics
Finance & Money Infographics
Food & Drink Infographics
Health Infographics
Historical Infographics
Home & Garden Infographics
Internet Infographics
Law and Legal Infographics
Lifestyle Infographics
Marketing Infographics
Offbeat Infographics
Parenting Infographics
Pets & Animals Infographics
Political Infographics
Shopping Infographics
Sports and Athletic Infographics
Technology Infographics
Transportation Infographics
Travel Infographics
Video Infographics