


Search 12,100+ Infographics!

6 Ways to Stay Motivated to Exercise Regularly
Setting a fitness goal isn’t a tough task but maintaining the consistency is. Every day you need the motivation to hit the gym and achieve your daily/weekly goal. Here are some of the best strategies which you can implement to motivate yourself to exercise regularly, all compiled into an infographic by Fit.

Commercial Video Marketing Statistics
Video marketing is critical for brands and companies to get more exposure and grow. Statistics show that by 2022 online video will make up more than 82% of the internet traffic. It’s critical that brands and companies get involved now before it’s too late. The most popular way to use video is for social media promotion but video can be used for many different marketing purposes. Studies also show that video increases organic search traffic on a website by 157%.
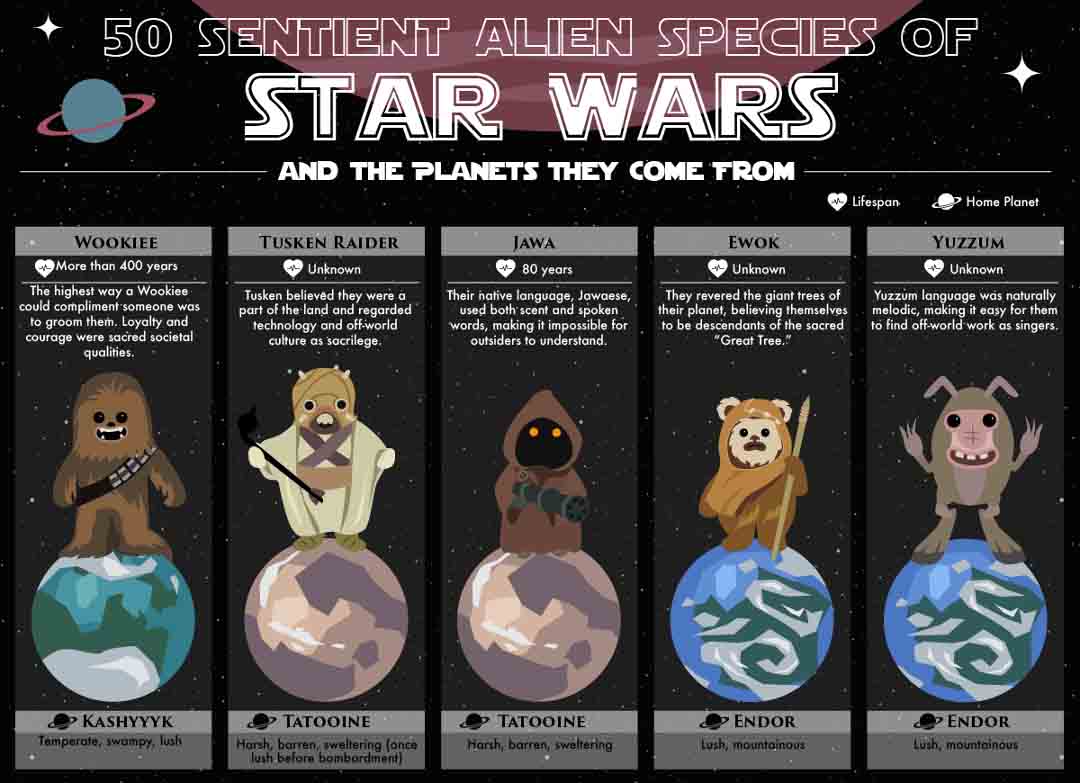
50 Sentient Alien Species of Star Wars
A long time ago in a galaxy far, far away … there were a lot of fascinating alien species. One of the most captivating components of the Star Wars universe is the biodiversity of such aliens. Some are adorable, like tree-dwelling teddy bear Ewoks from Endor, while others are not. Learn more about them all with this infographic.
Best Travel Destinations in 2020
The growth in leisure travelers is being foreseen, as stated in the 2018 statistical data from U.S. Commerce Department’s National Travel and Tourism Office. Since 2020 is now upon us, traveling can be something to look forward; however, while there could be various places where you can have the best holiday, you’ll likely end up struggling on where to have your vacation. Luckily, this infographic looks at some of the best places to travel in 2020.

How Much Do You Know About Data Security?
The team at USB Makers recently conducted a study whereby they asked business professionals and owners how much they knew about their data and its security. What they found was that most of the general population are worried about their personal or financial data being hacked, 65% in fact, and yet 78% are not worried about a data breach within their business.
Ways To Make Your Home Safer
Our homes should be the most secure places in our lives. But if you ask most people about homes’ security, they have no idea how safe they are. As long as they have locked the doors and windows, they think that they are safe. But that is not enough to deter intruders and keep a home safe. In this infographic, look at 10 ways to make your home safer.

50 Bird Species and the Sounds They Make
Bird songs may sound like whimsical fun to humans, but for birds, it is a complex system with key functions. The primary purpose of bird vocalization is to attract mates. The second main purpose of bird calls and songs is territory defense. Check out the following infographic to discover 50 bird species and the sounds they make.

Timeline of Harry and Meghan’s Relationship
Prince Harry and Meghan Markle’s unprecedented decision to step back as senior members of the royal family has enthralled and divided Britain. Following Megxit talks, a severance deal – likened to the hard Brexit of Boris Johnson – was announced on January 18, 2020. It shows a decisive and unsentimental move by the Queen, as the royal family is making a clean break with two of its most popular members.

The Teeth of 25 Dinosaurs and Other Prehistoric Creatures
Dinosaur fossils have been discovered on all seven continents, shedding some light on the prehistoric world. Many fossils have contained varying forms of teeth, from sharp, serrated front teeth to grip and pull flesh to complex dental batteries designed to strip and grind plant material. Check out the following visual chart on the teeth from 25 dinosaurs and other prehistoric creatures.

The Ultimate Cheat Sheet for LinkedIn Ad Types
LinkedIn marketing has many advantages that make it stand out. Depending on your marketing goals, these ads can serve your business by attracting customers. LinkedIn offers many unique benefits over other networks. In this infographic, TechWyse has put together the ultimate cheat sheet for LinkedIn ad types.
6 Ways to Stay Motivated to Exercise Regularly
Setting a fitness goal isn’t a tough task but maintaining the consistency is. Every day you need the motivation to hit the gym and achieve your daily/weekly goal. Here are some of the best strategies which you can implement to motivate yourself to exercise regularly, all compiled into an infographic by Fit.
Commercial Video Marketing Statistics
Video marketing is critical for brands and companies to get more exposure and grow. Statistics show that by 2022 online video will make up more than 82% of the internet traffic. It’s critical that brands and companies get involved now before it’s too late. The most popular way to use video is for social media promotion but video can be used for many different marketing purposes. Studies also show that video increases organic search traffic on a website by 157%.
50 Sentient Alien Species of Star Wars
A long time ago in a galaxy far, far away … there were a lot of fascinating alien species. One of the most captivating components of the Star Wars universe is the biodiversity of such aliens. Some are adorable, like tree-dwelling teddy bear Ewoks from Endor, while others are not. Learn more about them all with this infographic.
Best Travel Destinations in 2020
The growth in leisure travelers is being foreseen, as stated in the 2018 statistical data from U.S. Commerce Department’s National Travel and Tourism Office. Since 2020 is now upon us, traveling can be something to look forward; however, while there could be various places where you can have the best holiday, you’ll likely end up struggling on where to have your vacation. Luckily, this infographic looks at some of the best places to travel in 2020.
How Much Do You Know About Data Security?
The team at USB Makers recently conducted a study whereby they asked business professionals and owners how much they knew about their data and its security. What they found was that most of the general population are worried about their personal or financial data being hacked, 65% in fact, and yet 78% are not worried about a data breach within their business.
Ways To Make Your Home Safer
Our homes should be the most secure places in our lives. But if you ask most people about homes’ security, they have no idea how safe they are. As long as they have locked the doors and windows, they think that they are safe. But that is not enough to deter intruders and keep a home safe. In this infographic, look at 10 ways to make your home safer.
50 Bird Species and the Sounds They Make
Bird songs may sound like whimsical fun to humans, but for birds, it is a complex system with key functions. The primary purpose of bird vocalization is to attract mates. The second main purpose of bird calls and songs is territory defense. Check out the following infographic to discover 50 bird species and the sounds they make.
Timeline of Harry and Meghan’s Relationship
Prince Harry and Meghan Markle’s unprecedented decision to step back as senior members of the royal family has enthralled and divided Britain. Following Megxit talks, a severance deal – likened to the hard Brexit of Boris Johnson – was announced on January 18, 2020. It shows a decisive and unsentimental move by the Queen, as the royal family is making a clean break with two of its most popular members.
The Teeth of 25 Dinosaurs and Other Prehistoric Creatures
Dinosaur fossils have been discovered on all seven continents, shedding some light on the prehistoric world. Many fossils have contained varying forms of teeth, from sharp, serrated front teeth to grip and pull flesh to complex dental batteries designed to strip and grind plant material. Check out the following visual chart on the teeth from 25 dinosaurs and other prehistoric creatures.
The Ultimate Cheat Sheet for LinkedIn Ad Types
LinkedIn marketing has many advantages that make it stand out. Depending on your marketing goals, these ads can serve your business by attracting customers. LinkedIn offers many unique benefits over other networks. In this infographic, TechWyse has put together the ultimate cheat sheet for LinkedIn ad types.
Partners


Browse Archives By Category
Animated Infographics
Business Infographics
Career & Jobs Infographics
Education Infographics
Entertainment Industry Infographics
Environmental Infographics
Finance & Money Infographics
Food & Drink Infographics
Health Infographics
Historical Infographics
Home & Garden Infographics
Internet Infographics
Law and Legal Infographics
Lifestyle Infographics
Marketing Infographics
Offbeat Infographics
Parenting Infographics
Pets & Animals Infographics
Political Infographics
Shopping Infographics
Sports and Athletic Infographics
Technology Infographics
Transportation Infographics
Travel Infographics
Video Infographics