


Search 12,100+ Infographics!

Healthcare Innovation in Prior Authorization Process Automation
The future of repeated prior authorization denials is hopefully a thing of the past soon enough. Learn how prior authorization process automation is changing the game in the following infographic, courtesy of Orbit Healthcare.

Understanding Contentious Probate
Here is a handy infographic from the UK based Judkins Solicitors that provides information about contentious probate – a legal term that refers to disputes that arise when settling a dead person’s estate. Learn what contentious probate is, the role of contentious probate solicitors, why you need a contentious probate solicitor, and common misconceptions.

Tire Pressure Defined: From Passenger Cars to Construction Heavyweights
Whether you’re a car owner or work in the automobile industry, understanding the importance of tire pressure is vital for vehicle performance and safety. Maintaining the correct tire pressure ensures optimal fuel efficiency, improves handling, and extends tire lifespan.
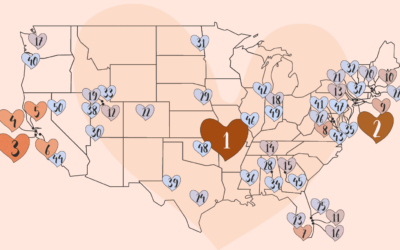
What Are the Most Charitable Counties in the United States?
Americans pride themselves on being good neighbors, which includes charitable donations and giving. The team at Harmony and Healing determined which American counties donate the biggest chunk of their income using data from the IRS. The result is a comprehensive map that shows which counties are home to the nation’s biggest givers.

10 Marketing Mistakes That Are Slowing Your Growth
This infographic entitled 10 Marketing Mistakes That Are Slowing Your Growth highlights the most common marketing pitfalls businesses face, from neglecting measurable goals to poor conversion tracking and misaligned messaging. Learn actionable fixes to each mistake to optimize your strategies, nurture leads, and maximize your marketing ROI.

Roadblocks to Success: Overcoming Business Challenges
Discover six major roadblocks that hinder business growth, such as unclear revenue drivers and inefficient planning. This infographic entitled, Roadblocks to Success: Overcoming Business Challenges, provides practical solutions to navigate these obstacles, achieve sustainable success, and take your business to the next level.

The Biggest Stock Market Events of the Past 100 Years
History proves that the stock market is vulnerable to major events and uncertainty, while peace and stability promote healthy markets. This study from the Madison Trust Company team demonstrates what kind of events and conditions cause the stock market to either crash or flourish.
What’s the Best Amusement Park in the United States?
Amusement park fans know that each park offers its own twist on thrilling rides and whimsical themes to offer a memorable experience and a day of family fun. Some families travel the country seeking out the very best amusement parks. With this new graphic, the team at Florida Rentals offers them the perfect travel guide.

How To Navigate Airports Like a Pro
Navigating airports can be a real challenge, from tricky security regulations to trying to spot your checked luggage in a sea of others at baggage claim. Whether you are a seasoned traveler or new to travel it’s worth taking a look at these pro tips from the Situ serviced accommodation specialists.

Protect Your Health: Why Gutter Cleaning Matters for Managing Allergies
Did you know that clogged gutters can contribute to allergy symptoms? In this infographic, learn how debris-filled gutters can harbor mold, mildew, and pollen, triggering allergic reactions. Discover the importance of regular gutter cleaning to improve indoor air quality and reduce allergy symptoms.
Healthcare Innovation in Prior Authorization Process Automation
The future of repeated prior authorization denials is hopefully a thing of the past soon enough. Learn how prior authorization process automation is changing the game in the following infographic, courtesy of Orbit Healthcare.
Understanding Contentious Probate
Here is a handy infographic from the UK based Judkins Solicitors that provides information about contentious probate – a legal term that refers to disputes that arise when settling a dead person’s estate. Learn what contentious probate is, the role of contentious probate solicitors, why you need a contentious probate solicitor, and common misconceptions.
Tire Pressure Defined: From Passenger Cars to Construction Heavyweights
Whether you’re a car owner or work in the automobile industry, understanding the importance of tire pressure is vital for vehicle performance and safety. Maintaining the correct tire pressure ensures optimal fuel efficiency, improves handling, and extends tire lifespan.
What Are the Most Charitable Counties in the United States?
Americans pride themselves on being good neighbors, which includes charitable donations and giving. The team at Harmony and Healing determined which American counties donate the biggest chunk of their income using data from the IRS. The result is a comprehensive map that shows which counties are home to the nation’s biggest givers.
10 Marketing Mistakes That Are Slowing Your Growth
This infographic entitled 10 Marketing Mistakes That Are Slowing Your Growth highlights the most common marketing pitfalls businesses face, from neglecting measurable goals to poor conversion tracking and misaligned messaging. Learn actionable fixes to each mistake to optimize your strategies, nurture leads, and maximize your marketing ROI.
Roadblocks to Success: Overcoming Business Challenges
Discover six major roadblocks that hinder business growth, such as unclear revenue drivers and inefficient planning. This infographic entitled, Roadblocks to Success: Overcoming Business Challenges, provides practical solutions to navigate these obstacles, achieve sustainable success, and take your business to the next level.
The Biggest Stock Market Events of the Past 100 Years
History proves that the stock market is vulnerable to major events and uncertainty, while peace and stability promote healthy markets. This study from the Madison Trust Company team demonstrates what kind of events and conditions cause the stock market to either crash or flourish.
What’s the Best Amusement Park in the United States?
Amusement park fans know that each park offers its own twist on thrilling rides and whimsical themes to offer a memorable experience and a day of family fun. Some families travel the country seeking out the very best amusement parks. With this new graphic, the team at Florida Rentals offers them the perfect travel guide.
How To Navigate Airports Like a Pro
Navigating airports can be a real challenge, from tricky security regulations to trying to spot your checked luggage in a sea of others at baggage claim. Whether you are a seasoned traveler or new to travel it’s worth taking a look at these pro tips from the Situ serviced accommodation specialists.
Protect Your Health: Why Gutter Cleaning Matters for Managing Allergies
Did you know that clogged gutters can contribute to allergy symptoms? In this infographic, learn how debris-filled gutters can harbor mold, mildew, and pollen, triggering allergic reactions. Discover the importance of regular gutter cleaning to improve indoor air quality and reduce allergy symptoms.
Partners


Browse Archives By Category
Animated Infographics
Business Infographics
Career & Jobs Infographics
Education Infographics
Entertainment Industry Infographics
Environmental Infographics
Finance & Money Infographics
Food & Drink Infographics
Health Infographics
Historical Infographics
Home & Garden Infographics
Internet Infographics
Law and Legal Infographics
Lifestyle Infographics
Marketing Infographics
Offbeat Infographics
Parenting Infographics
Pets & Animals Infographics
Political Infographics
Shopping Infographics
Sports and Athletic Infographics
Technology Infographics
Transportation Infographics
Travel Infographics
Video Infographics