


Search 12,100+ Infographics!

Top AI Business Ideas
Artificial Intelligence is revolutionizing industries, creating highly profitable business opportunities in the USA. Here is an infographic that explores top AI business ideas with high investment potential, including AI-driven healthcare software, mental health apps, AI-powered video generation platforms, and AI-enhanced agriculture solutions.
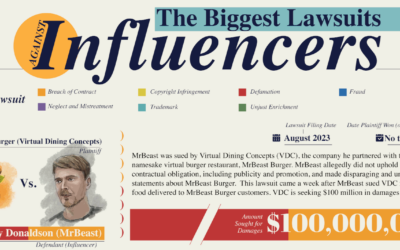
The Biggest Lawsuits Against Influencers
The team at LLC Attorney offers us a look at some of the most fascinating lawsuits with a graphic outlining the biggest lawsuits against influencers. There are influencers with such a high level of fame that they’ve gone on to create successful multi-million-dollar businesses or used their platform to sway public opinion.
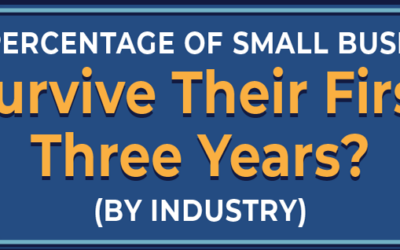
What Percentage of Businesses Fail in Their First Three Years?
Many people starting a business are concerned with long-term projections for growth and success. The team at LLC Attorney zeroed in on what’s most important with a graphic showing business survival rates up to 3 years. Discover the percentage of business survival rates in their first, second, and third years, broken down by industry.
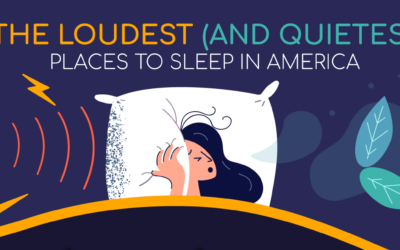
The Loudest (and Quietest) Places to Sleep in America
Sleep is vital to good health and well-being, but achieving quality sleep can be challenging, depending on your environment. Different factors can stop us from getting a whole night’s rest, but the noise level may be one of the most impactful factors.
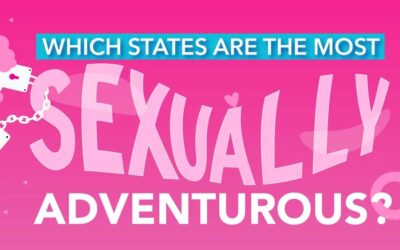
Which States Are the Most Sexually Adventurous?
The team at Too Timid invited Americans to answer some intimate questions about their sex lives to figure out which states are the most adventurous. They asked 1,427 Americans questions about these subjects: average number of sex toys, sexual partners, sexual experiences, and sexual fantasies that are a turn-on.
Where Does America Sleep?
With their new study, the team at NapLab focused on a fascinating area of sleep: where Americans across the nation sleep at night. The findings in this study offer insight into how many people can afford a home, how many live in group settings, and other fascinating details.
12 Sensory Play Ideas For Teachers
Early childhood teachers are busy people who constantly create new and exciting activities for children in the classroom. Many of these activities incorporate sensory play, a concept incorporating the five senses into learning activities. The team at AAA State of Play made lesson plans easy with 12 play activities themed to the months of the year.
Serviced Accommodation: 8 Common Myths Busted
Experts from the global serviced accommodations specialists Situ, dispel some common myths about serviced accommodation in this infographic. They start with the cost. Contrary to general opinion, serviced accommodation is actually cheaper than a hotel for longer stays.
Mouse Olympics: Record-Breaking Feats
Here is an infographic showcasing the astonishing athletic abilities of mice. From high jumps to long-distance sprints, these tiny rodents display incredible speed, agility, and strength compared to humans.
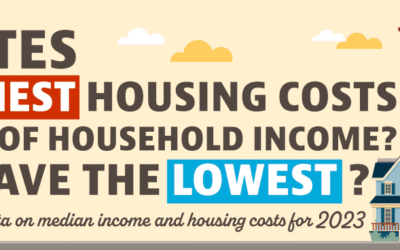
Which States Have the Highest Housing Costs as a Percentage of Household Income?
The team at Madison Trust Company used extensive Census Bureau data to determine where people spend the highest percentage of their income on housing. They found which states have the highest and lowest housing costs and ranked them on a colorful map.
Top AI Business Ideas
Artificial Intelligence is revolutionizing industries, creating highly profitable business opportunities in the USA. Here is an infographic that explores top AI business ideas with high investment potential, including AI-driven healthcare software, mental health apps, AI-powered video generation platforms, and AI-enhanced agriculture solutions.
The Biggest Lawsuits Against Influencers
The team at LLC Attorney offers us a look at some of the most fascinating lawsuits with a graphic outlining the biggest lawsuits against influencers. There are influencers with such a high level of fame that they’ve gone on to create successful multi-million-dollar businesses or used their platform to sway public opinion.
What Percentage of Businesses Fail in Their First Three Years?
Many people starting a business are concerned with long-term projections for growth and success. The team at LLC Attorney zeroed in on what’s most important with a graphic showing business survival rates up to 3 years. Discover the percentage of business survival rates in their first, second, and third years, broken down by industry.
The Loudest (and Quietest) Places to Sleep in America
Sleep is vital to good health and well-being, but achieving quality sleep can be challenging, depending on your environment. Different factors can stop us from getting a whole night’s rest, but the noise level may be one of the most impactful factors.
Which States Are the Most Sexually Adventurous?
The team at Too Timid invited Americans to answer some intimate questions about their sex lives to figure out which states are the most adventurous. They asked 1,427 Americans questions about these subjects: average number of sex toys, sexual partners, sexual experiences, and sexual fantasies that are a turn-on.
Where Does America Sleep?
With their new study, the team at NapLab focused on a fascinating area of sleep: where Americans across the nation sleep at night. The findings in this study offer insight into how many people can afford a home, how many live in group settings, and other fascinating details.
12 Sensory Play Ideas For Teachers
Early childhood teachers are busy people who constantly create new and exciting activities for children in the classroom. Many of these activities incorporate sensory play, a concept incorporating the five senses into learning activities. The team at AAA State of Play made lesson plans easy with 12 play activities themed to the months of the year.
Serviced Accommodation: 8 Common Myths Busted
Experts from the global serviced accommodations specialists Situ, dispel some common myths about serviced accommodation in this infographic. They start with the cost. Contrary to general opinion, serviced accommodation is actually cheaper than a hotel for longer stays.
Mouse Olympics: Record-Breaking Feats
Here is an infographic showcasing the astonishing athletic abilities of mice. From high jumps to long-distance sprints, these tiny rodents display incredible speed, agility, and strength compared to humans.
Which States Have the Highest Housing Costs as a Percentage of Household Income?
The team at Madison Trust Company used extensive Census Bureau data to determine where people spend the highest percentage of their income on housing. They found which states have the highest and lowest housing costs and ranked them on a colorful map.
Partners


Browse Archives By Category
Animated Infographics
Business Infographics
Career & Jobs Infographics
Education Infographics
Entertainment Industry Infographics
Environmental Infographics
Finance & Money Infographics
Food & Drink Infographics
Health Infographics
Historical Infographics
Home & Garden Infographics
Internet Infographics
Law and Legal Infographics
Lifestyle Infographics
Marketing Infographics
Offbeat Infographics
Parenting Infographics
Pets & Animals Infographics
Political Infographics
Shopping Infographics
Sports and Athletic Infographics
Technology Infographics
Transportation Infographics
Travel Infographics
Video Infographics