


Search 12,100+ Infographics!

Profiling Buyers of Real Estate: Which One Are You?
Over the years that the team at Premium Properties PH have been engaged in the real estate brokering business, they have seen all kinds and sorts of buyers. Here is an infographic that features some of those that have stood out over the course of time that we have been in this business.

How to Perfectly Optimize Your Website for Google
Since it became the preferred search engine of the world, Search Engine Optimization (SEO) has always really meant optimizing for Google. Even now, Google dominates the world of search, occupying 92.19% of market-share worldwide and imperiously shoving aside its not-so-close competitors Bing and Yahoo. It goes without saying, then, that perfectly optimizing your website for Google is still the best course of action for plenty of business owners and webmasters.
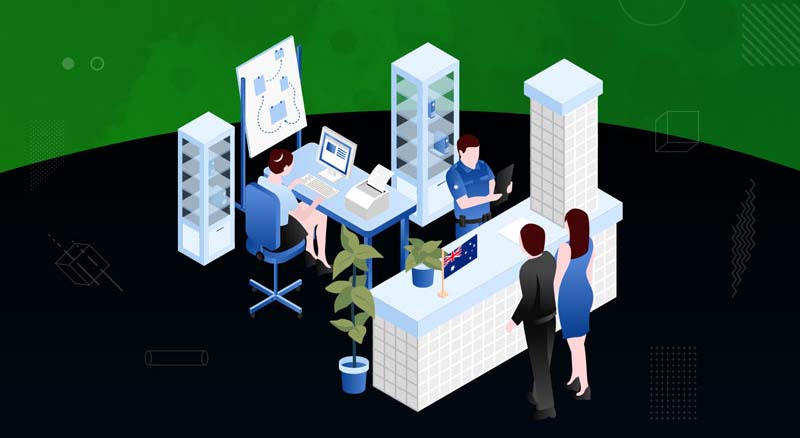
Know the Process of Lodging a National Police Check in Australia
At the time of applying for a new job, a National Police check certificate is required by your potential recruiter. Now the real challenge for you is successfully submitting the application. But are you aware of the process? Want to go through it thoroughly before applying? In the following infographic, understand the process of lodging a National Police Check in Australia.
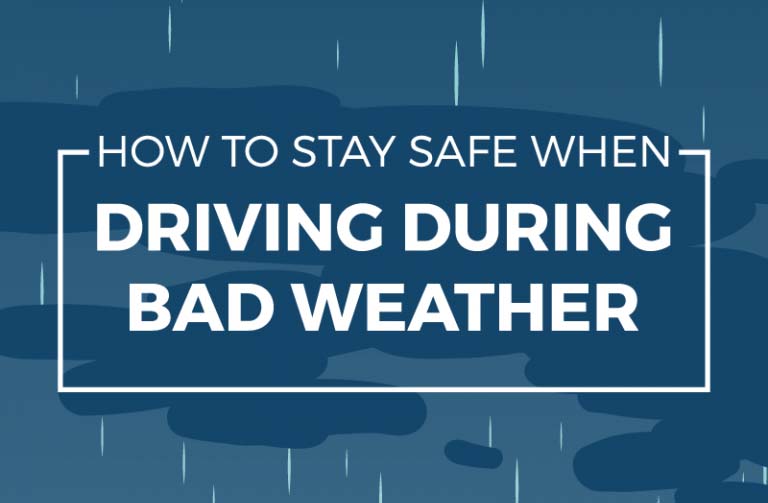
How to Stay Safe When Driving During Bad Weather
No matter how good you are at driving, you have to keep in mind that accidents can happen unexpectedly. Most people don’t realize it, but every time you’re on the road, you and other road users are always at risk of danger. Accidents can happen in a split second, but the risk of one happening can always be reduced when drivers comply with safe driving practices.
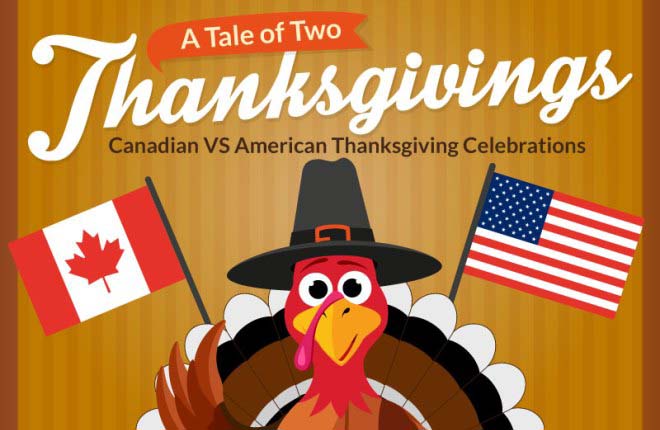
A Tale of Two Thanksgivings: Canadian VS American Thanksgiving Celebrations
Thanksgiving is a time to enjoy food, family and friends. Canada and The United States celebrate this holiday and give thanks, but there are some big differences in the way the neighboring countries commemorate their special day. Here is an interesting infographic that shows the difference between Canadian and American thanksgiving celebrations.
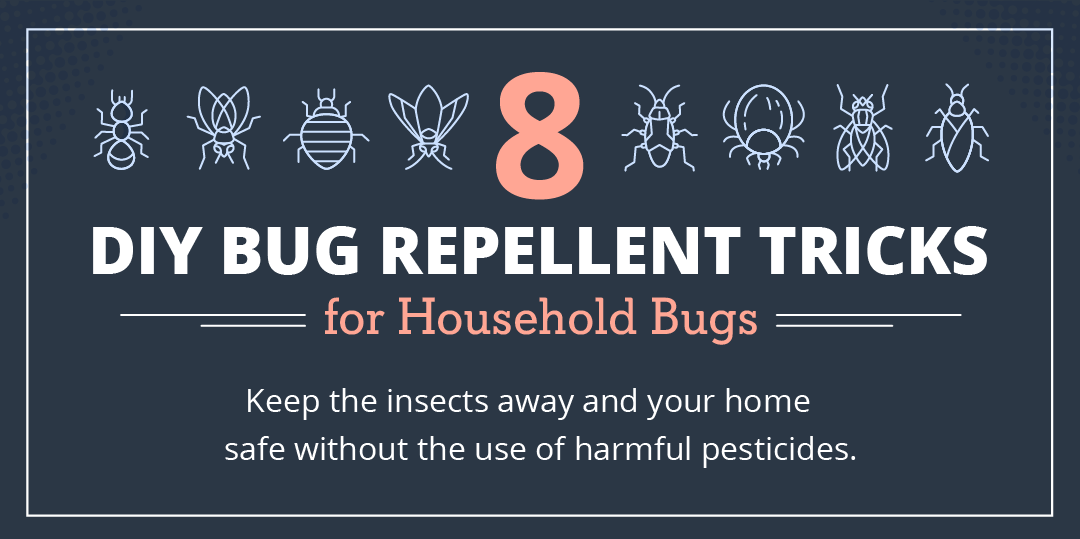
DIY Bug Repellent Tricks for Common Household Bugs
Most people do not like bugs, especially when they inhabit our living spaces. The goal is to keep them away, oftentimes with pesticides. However, traditional pesticides contain many ingredients that are harmful to all living creatures, not just insects. In order to keep yourself, your family and your pets safe this summer, take a look at these natural pest control strategies for the most common bug invader.

Biomimicry: Technology Inspired by Nature
The solutions nature have come up with to overcome the challenges of an ever-changing environment are so complex and so well thought out, that they’re inspiring new technologies. Check out this infographic to see the nature inspired innovations that will affect our everyday lives in the near future.
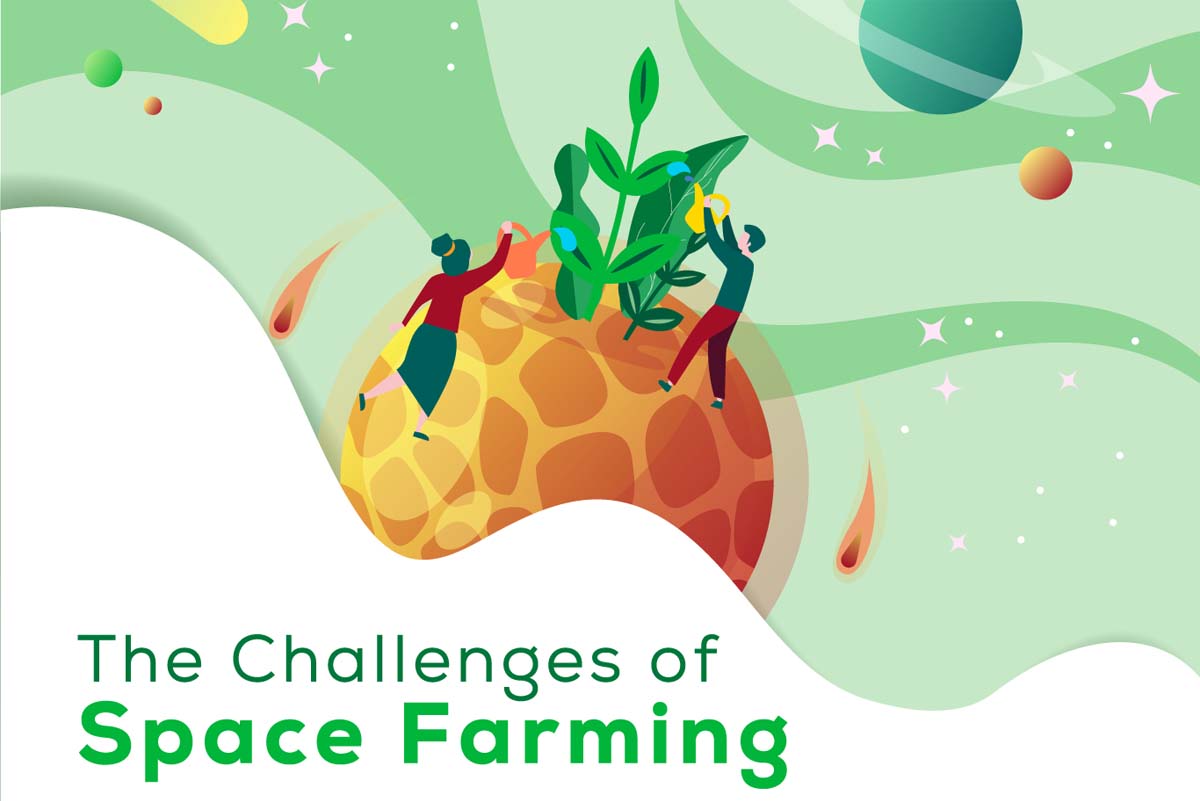
The Challenges of Space Farming
Space flight has always pushed innovation to its limits and as we set our sights on Mars, we’re now trying to understand some of the more challenging concepts of long-term space travel. Two of the largest, although not the only issues are our food supply and the life support system. In this infographic, The Greenhouse People explore the difficulties of growing plants in space.
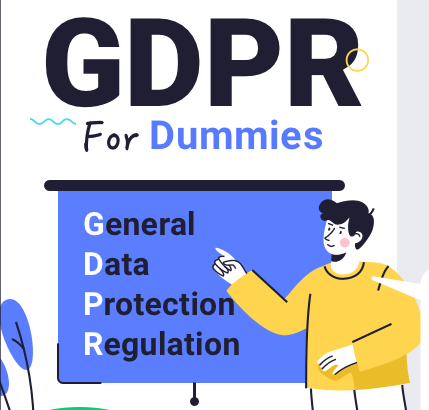
GDPR for Dummies
We live in a data-driven world. Everything you share online is processed and stored, whether you’re booking a flight or posting a photo on social media. Companies that handle data are responsible for keeping it safe. To ensure they’re held accountable, new global privacy laws have been passed — the most well known being the GDPR. The team at Termly has designed the following infographic that explains the basics of the General Data Protection Regulation (GDPR).
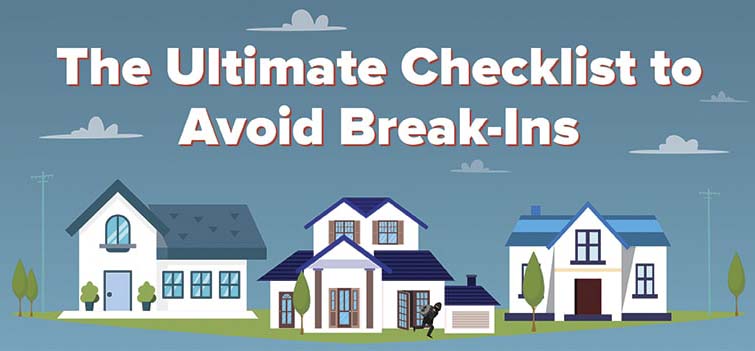
The Ultimate Checklist to Avoid Break-Ins
Most burglaries and break-ins are preventable, but some homeowners aren’t sure how to best protect their property. Home security is something that everyone should know about, and fortunately, it isn’t a complex topic. With a bit of research and dedication, anyone can make their home safer. The peace of mind that comes with certain home security can’t be overstated.
Profiling Buyers of Real Estate: Which One Are You?
Over the years that the team at Premium Properties PH have been engaged in the real estate brokering business, they have seen all kinds and sorts of buyers. Here is an infographic that features some of those that have stood out over the course of time that we have been in this business.
How to Perfectly Optimize Your Website for Google
Since it became the preferred search engine of the world, Search Engine Optimization (SEO) has always really meant optimizing for Google. Even now, Google dominates the world of search, occupying 92.19% of market-share worldwide and imperiously shoving aside its not-so-close competitors Bing and Yahoo. It goes without saying, then, that perfectly optimizing your website for Google is still the best course of action for plenty of business owners and webmasters.
Know the Process of Lodging a National Police Check in Australia
At the time of applying for a new job, a National Police check certificate is required by your potential recruiter. Now the real challenge for you is successfully submitting the application. But are you aware of the process? Want to go through it thoroughly before applying? In the following infographic, understand the process of lodging a National Police Check in Australia.
How to Stay Safe When Driving During Bad Weather
No matter how good you are at driving, you have to keep in mind that accidents can happen unexpectedly. Most people don’t realize it, but every time you’re on the road, you and other road users are always at risk of danger. Accidents can happen in a split second, but the risk of one happening can always be reduced when drivers comply with safe driving practices.
A Tale of Two Thanksgivings: Canadian VS American Thanksgiving Celebrations
Thanksgiving is a time to enjoy food, family and friends. Canada and The United States celebrate this holiday and give thanks, but there are some big differences in the way the neighboring countries commemorate their special day. Here is an interesting infographic that shows the difference between Canadian and American thanksgiving celebrations.
DIY Bug Repellent Tricks for Common Household Bugs
Most people do not like bugs, especially when they inhabit our living spaces. The goal is to keep them away, oftentimes with pesticides. However, traditional pesticides contain many ingredients that are harmful to all living creatures, not just insects. In order to keep yourself, your family and your pets safe this summer, take a look at these natural pest control strategies for the most common bug invader.
Biomimicry: Technology Inspired by Nature
The solutions nature have come up with to overcome the challenges of an ever-changing environment are so complex and so well thought out, that they’re inspiring new technologies. Check out this infographic to see the nature inspired innovations that will affect our everyday lives in the near future.
The Challenges of Space Farming
Space flight has always pushed innovation to its limits and as we set our sights on Mars, we’re now trying to understand some of the more challenging concepts of long-term space travel. Two of the largest, although not the only issues are our food supply and the life support system. In this infographic, The Greenhouse People explore the difficulties of growing plants in space.
GDPR for Dummies
We live in a data-driven world. Everything you share online is processed and stored, whether you’re booking a flight or posting a photo on social media. Companies that handle data are responsible for keeping it safe. To ensure they’re held accountable, new global privacy laws have been passed — the most well known being the GDPR. The team at Termly has designed the following infographic that explains the basics of the General Data Protection Regulation (GDPR).
The Ultimate Checklist to Avoid Break-Ins
Most burglaries and break-ins are preventable, but some homeowners aren’t sure how to best protect their property. Home security is something that everyone should know about, and fortunately, it isn’t a complex topic. With a bit of research and dedication, anyone can make their home safer. The peace of mind that comes with certain home security can’t be overstated.
Partners


Browse Archives By Category
Animated Infographics
Business Infographics
Career & Jobs Infographics
Education Infographics
Entertainment Industry Infographics
Environmental Infographics
Finance & Money Infographics
Food & Drink Infographics
Health Infographics
Historical Infographics
Home & Garden Infographics
Internet Infographics
Law and Legal Infographics
Lifestyle Infographics
Marketing Infographics
Offbeat Infographics
Parenting Infographics
Pets & Animals Infographics
Political Infographics
Shopping Infographics
Sports and Athletic Infographics
Technology Infographics
Transportation Infographics
Travel Infographics
Video Infographics