


Search 12,100+ Infographics!
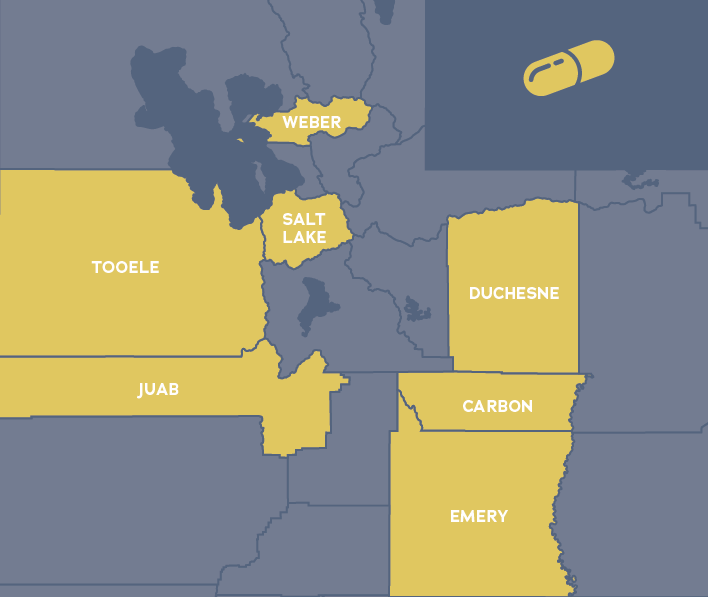
Opioid Epidemic in Utah
The opioid epidemic has been a national story-line for the past few years. No community, including those in Utah, has been left unaffected. This infographic from Acqua Recovery Center explores some of the statistics about the opioid epidemic in the state of Utah.

Learn How To Build A Website
In the following infographic, learn how to build a website with WordPress as you discover the steps of registering a domain name, setting up your hosting, configuring the content management system, designing your website and optimizing your pages to be SEO friendly.

55 Popular Diet Swaps to Satisfy Every Craving
It’s estimated that approximately 45 million Americans go on a diet each year and spend around $33 billion on weight-loss products. Despite all of this, just about two-thirds of Americans are either overweight or obese. There are countless diets out there, but it’s key to pick one that you’re able to stick with. This infographic outlines 55 of the most popular diet swaps to satisfy every craving.

The Entrepreneur’s Journey
There are a lot of myths and hype out there as to what entrepreneur deal with and experience on their way to success. In this infographic from AlejandroCremades.com, learn what the entrepreneur’s journey to success really looks like. [Click here for full size...
Top 8 Local Pack Finder Ranking Factors
In the following infographic, Ever Increasing Circles takes you through the 8 core steps small business owners and local marketers should use in order to help improve their chances of local search rankings.

How Does Gambling Affect Us
Experts have conducted a series of studies and found that online gambling at places in moderation is beneficial for the body as it can improve your mood, relieve fatigue, increase stress resistance, and train your memory.

How Crypto Is Disrupting the Financial Ecosystem
With Facebook’s Libra set to come out next year, the word cryptocurrency is on everyone’s lips. Blockchain is bringing a revolutionary new way of handling data, but even experts aren’t sure of the exact impact it will have on banks, the government, and the financial ecosystem itself.
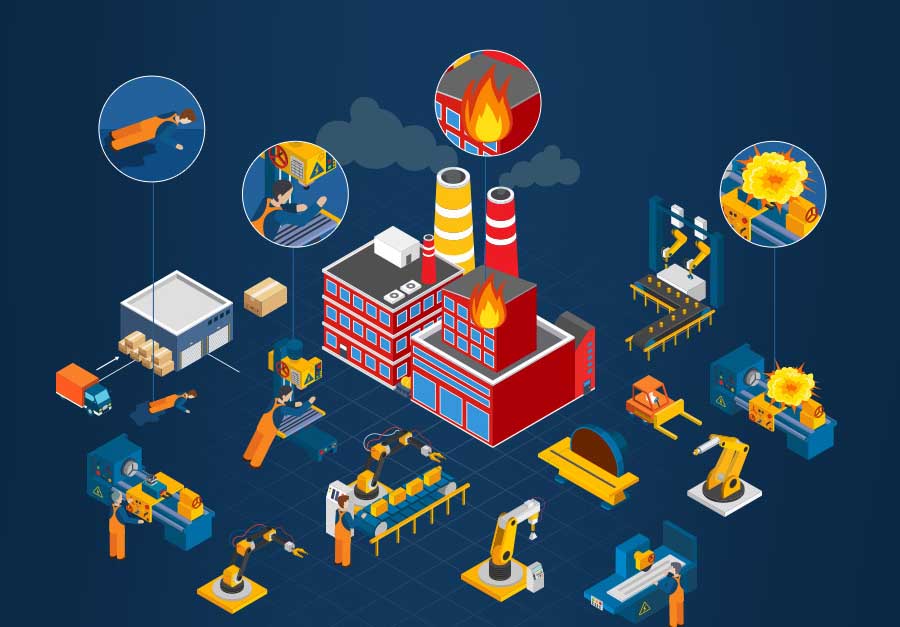
Industrial Accidents in Illinois and How to Prevent Them
A workplace injury ranks number three in the list of causes of deaths in the U.S. In Illinois, transportation incidents accounted for 37% of fatalities where 17% happened due to falls, slips, and trips, 14% by moving objects, 13% due to exposure to harmful substances, and 18% due to other reasons In the following infographic, look at industrial accidents in Illinois and how to prevent them.
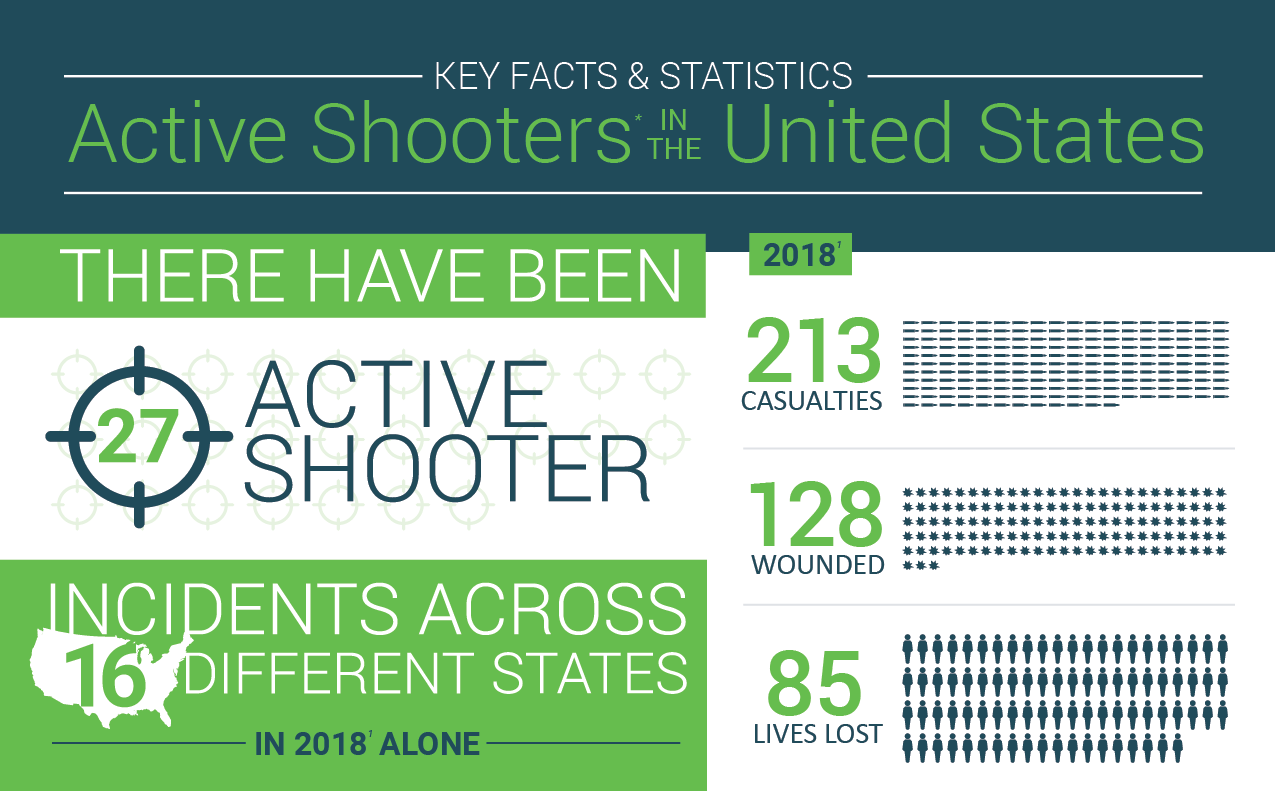
Active Shooters in the United States- Key Facts & Statistics 2018
Active shooter incidents have become an increasingly prevalent problem over the past decade. In an FBI study of active shooter incidents from 2000-2018, we see that 2017 was the worst year on record, with 2018 being a close second. Given the range of locations that active shooter events take place at, effectively responding to these incidents to reduce harm and save lives is a task that falls not just to the police, but to EMS personnel, security and public safety officials, schools, office managers, and members of the public.
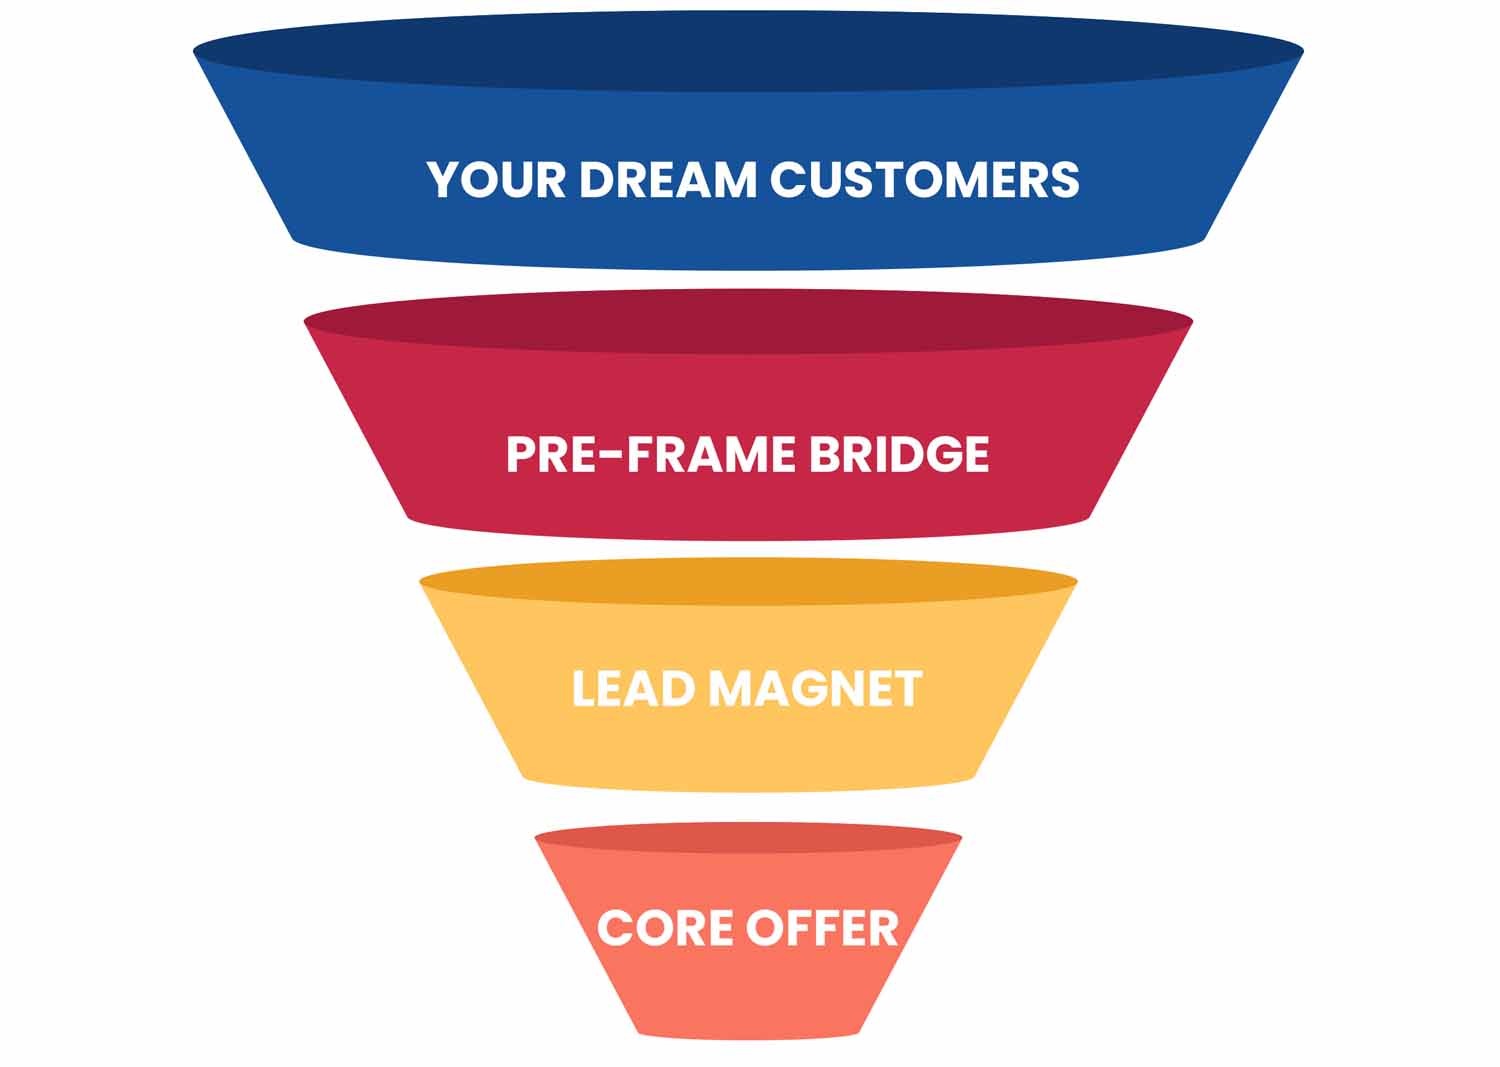
6 Steps To Build A Sales Funnel That Converts Visitors Into Customers
Creating a sales funnel is the best way to generate more leads and convert them into customers. It doesn’t matter any niche or market you find yourself; sales funnel software can help you to present your lead magnet and make visitors subscribe to your list in exchange for their email.
Opioid Epidemic in Utah
The opioid epidemic has been a national story-line for the past few years. No community, including those in Utah, has been left unaffected. This infographic from Acqua Recovery Center explores some of the statistics about the opioid epidemic in the state of Utah.
Learn How To Build A Website
In the following infographic, learn how to build a website with WordPress as you discover the steps of registering a domain name, setting up your hosting, configuring the content management system, designing your website and optimizing your pages to be SEO friendly.
55 Popular Diet Swaps to Satisfy Every Craving
It’s estimated that approximately 45 million Americans go on a diet each year and spend around $33 billion on weight-loss products. Despite all of this, just about two-thirds of Americans are either overweight or obese. There are countless diets out there, but it’s key to pick one that you’re able to stick with. This infographic outlines 55 of the most popular diet swaps to satisfy every craving.
The Entrepreneur’s Journey
There are a lot of myths and hype out there as to what entrepreneur deal with and experience on their way to success. In this infographic from AlejandroCremades.com, learn what the entrepreneur’s journey to success really looks like. [Click here for full size...
Top 8 Local Pack Finder Ranking Factors
In the following infographic, Ever Increasing Circles takes you through the 8 core steps small business owners and local marketers should use in order to help improve their chances of local search rankings.
How Does Gambling Affect Us
Experts have conducted a series of studies and found that online gambling at places in moderation is beneficial for the body as it can improve your mood, relieve fatigue, increase stress resistance, and train your memory.
How Crypto Is Disrupting the Financial Ecosystem
With Facebook’s Libra set to come out next year, the word cryptocurrency is on everyone’s lips. Blockchain is bringing a revolutionary new way of handling data, but even experts aren’t sure of the exact impact it will have on banks, the government, and the financial ecosystem itself.
Industrial Accidents in Illinois and How to Prevent Them
A workplace injury ranks number three in the list of causes of deaths in the U.S. In Illinois, transportation incidents accounted for 37% of fatalities where 17% happened due to falls, slips, and trips, 14% by moving objects, 13% due to exposure to harmful substances, and 18% due to other reasons In the following infographic, look at industrial accidents in Illinois and how to prevent them.
Active Shooters in the United States- Key Facts & Statistics 2018
Active shooter incidents have become an increasingly prevalent problem over the past decade. In an FBI study of active shooter incidents from 2000-2018, we see that 2017 was the worst year on record, with 2018 being a close second. Given the range of locations that active shooter events take place at, effectively responding to these incidents to reduce harm and save lives is a task that falls not just to the police, but to EMS personnel, security and public safety officials, schools, office managers, and members of the public.
6 Steps To Build A Sales Funnel That Converts Visitors Into Customers
Creating a sales funnel is the best way to generate more leads and convert them into customers. It doesn’t matter any niche or market you find yourself; sales funnel software can help you to present your lead magnet and make visitors subscribe to your list in exchange for their email.
Partners


Browse Archives By Category
Animated Infographics
Business Infographics
Career & Jobs Infographics
Education Infographics
Entertainment Industry Infographics
Environmental Infographics
Finance & Money Infographics
Food & Drink Infographics
Health Infographics
Historical Infographics
Home & Garden Infographics
Internet Infographics
Law and Legal Infographics
Lifestyle Infographics
Marketing Infographics
Offbeat Infographics
Parenting Infographics
Pets & Animals Infographics
Political Infographics
Shopping Infographics
Sports and Athletic Infographics
Technology Infographics
Transportation Infographics
Travel Infographics
Video Infographics