


Search 12,000+ Infographics!
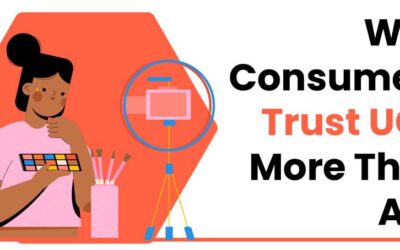
Why Consumers Trust UGC More Than Traditional Ads
Branded feeds are overcrowded, so brands now cut through the noise with the real stuff: user-generated content (UGC). This infographic shows that 60 % of consumers view user-generated content as the most authentic, nearly 10× more persuasive than influencer posts.

Drunk Driving Statistics 2025
Drunk driving claims approximately 34 lives every day across the U.S. These deaths are preventable, but they continue to occur due to impaired judgment and the assumption that driving after just one drink is safe. This infographic dives into drunk driving in the United States, including its prevalence, its impact, and its consequences.

Every Color You Can Buy a Camaro in Every Year Since 1967
The following graphic from Speedway Motors is an excellent visualization of automotive data and history. It showcases the Camaro and every shade of color it was available in each year. That’s decades of history represented since 1967.

Where Are Most Kindergartners Not Up to Date on Measles Vaccines?
The team at PARequirements unveil a new map highlighting measles vaccinations, examining the number of kindergartners who received a measles vaccine in each state, compared to the total number of children, and showed us the percentage of children who aren’t up to date with their vaccines in each state.

The Biggest Employers by Industry
Infographics can be a powerful way to visualize changes in our economy, as proven in this study from The Chartistry. Their graphic reveals which companies employ the biggest workforce across a variety of industries. We can learn a lot about how sectors are growing and declining based on workforce numbers.

The Hardest-to-Pronounce Pokémon Names
For over 25 years, Pokémon has earned loyal fans who have formed a tight-knit community, complete with card trading, watch parties, and co-op video games. The nostalgia of Pokémon is undeniable, and the team at PixlParade celebrates that pop culture legacy with a guide to the most difficult-to-pronounce Pokémon names.

What Are Your Chances of Getting an STD?
What exactly are your chances of getting an STD? It can vary based on where you live and what you do. Learn more in the infographic below, courtesy of eNationalTesting.com.
The Core Elements Every Website Needs to Rank in Search
A well-rounded SEO strategy combines traditional SEO, on-page and technical optimization, local SEO, and Answer Engine Optimization (AEO) to boost online visibility and user engagement. Here is an infographic that looks at the core elements every website needs to rank in search.

How To Tell If Someone Is Lying: 8 Signs To Watch Out For
Here is an infographic courtesy of F3 Investigations, an Orlando Scam Investigator .that reveals eight behavioral red flags that may indicate someone is lying, along with ethical strategies to calmly observe and respond.

The Impact of LA Wildfires
The LA wildfires were a devastating event. They clearly showed the importance of having a proper tree service expert to manage forests and tree growth. Learn more about the impact of the LA wildfires in the following infographic courtesy of Tree Service Expert.
Why Consumers Trust UGC More Than Traditional Ads
Branded feeds are overcrowded, so brands now cut through the noise with the real stuff: user-generated content (UGC). This infographic shows that 60 % of consumers view user-generated content as the most authentic, nearly 10× more persuasive than influencer posts.
Drunk Driving Statistics 2025
Drunk driving claims approximately 34 lives every day across the U.S. These deaths are preventable, but they continue to occur due to impaired judgment and the assumption that driving after just one drink is safe. This infographic dives into drunk driving in the United States, including its prevalence, its impact, and its consequences.
Every Color You Can Buy a Camaro in Every Year Since 1967
The following graphic from Speedway Motors is an excellent visualization of automotive data and history. It showcases the Camaro and every shade of color it was available in each year. That’s decades of history represented since 1967.
Where Are Most Kindergartners Not Up to Date on Measles Vaccines?
The team at PARequirements unveil a new map highlighting measles vaccinations, examining the number of kindergartners who received a measles vaccine in each state, compared to the total number of children, and showed us the percentage of children who aren’t up to date with their vaccines in each state.
The Biggest Employers by Industry
Infographics can be a powerful way to visualize changes in our economy, as proven in this study from The Chartistry. Their graphic reveals which companies employ the biggest workforce across a variety of industries. We can learn a lot about how sectors are growing and declining based on workforce numbers.
The Hardest-to-Pronounce Pokémon Names
For over 25 years, Pokémon has earned loyal fans who have formed a tight-knit community, complete with card trading, watch parties, and co-op video games. The nostalgia of Pokémon is undeniable, and the team at PixlParade celebrates that pop culture legacy with a guide to the most difficult-to-pronounce Pokémon names.
What Are Your Chances of Getting an STD?
What exactly are your chances of getting an STD? It can vary based on where you live and what you do. Learn more in the infographic below, courtesy of eNationalTesting.com.
The Core Elements Every Website Needs to Rank in Search
A well-rounded SEO strategy combines traditional SEO, on-page and technical optimization, local SEO, and Answer Engine Optimization (AEO) to boost online visibility and user engagement. Here is an infographic that looks at the core elements every website needs to rank in search.
How To Tell If Someone Is Lying: 8 Signs To Watch Out For
Here is an infographic courtesy of F3 Investigations, an Orlando Scam Investigator .that reveals eight behavioral red flags that may indicate someone is lying, along with ethical strategies to calmly observe and respond.
The Impact of LA Wildfires
The LA wildfires were a devastating event. They clearly showed the importance of having a proper tree service expert to manage forests and tree growth. Learn more about the impact of the LA wildfires in the following infographic courtesy of Tree Service Expert.
Partners


Browse Archives By Category
Animated Infographics
Business Infographics
Career & Jobs Infographics
Education Infographics
Entertainment Industry Infographics
Environmental Infographics
Finance & Money Infographics
Food & Drink Infographics
Health Infographics
Historical Infographics
Home & Garden Infographics
Internet Infographics
Law and Legal Infographics
Lifestyle Infographics
Marketing Infographics
Offbeat Infographics
Parenting Infographics
Pets & Animals Infographics
Political Infographics
Shopping Infographics
Sports and Athletic Infographics
Technology Infographics
Transportation Infographics
Travel Infographics
Video Infographics