


Search 12,100+ Infographics!

3 Guaranteed Ways to Prevent Your Kid’s Digital Addiction
Digital addiction is real and similar to drug and alcohol addiction. Unfortunately, children are getting addicted to digital screens as they play video games or watch videos for hours. Research shows that children who are exposed to more than an hour a day in front of digital screens, increase their suicidal thoughts by 72%, reduce their academic performance by 18% and it makes them more socially secluded.

How to Increase Online Store Sales With Product Reviews
In the world of eCommerce, gaining customer trust is vital as customer’s purchases can be heavily influenced by product ratings and reviews. More positive ratings and product reviews can mean more customers and ultimately, more revenue. In the following infographic, Cogneesol looks at how to increase online store sales with product reviews.
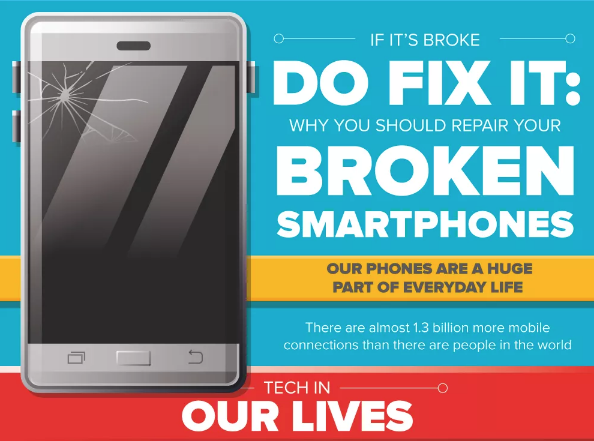
If It’s Broke DO Fix It: Why You Should Repair Your Broken Smartphones
Cell phones are a big part of everyday American life. However, broken smartphones happen all too often. You drop it, it falls out of your pocket, or maybe you knock it off the table. Now what? Learn why it’s smart to repair instead of replace in this infographic.

An Overview of Healthcare Insurance
Healthcare insurance in the United States can often be a tricky matter with many not understanding the basic vocabulary and statistics behind it. Uninformed views of it can cause people to buy improper services for themselves. This infographic seeks to inform viewers so they can make the right healthcare decision for themselves.

Binge Drinking Statistics
Alcohol is one of the most common substances used in the United States. The accessibility of alcohol makes it much easier for people of all ages and social classes to get their hands on. Binge drinking statistics in the US are alarming. These statistics reveal just how dangerous over-consumption of alcohol really is. In the following infographic, Crestview Recovery visualizes some binge drinking statistics.
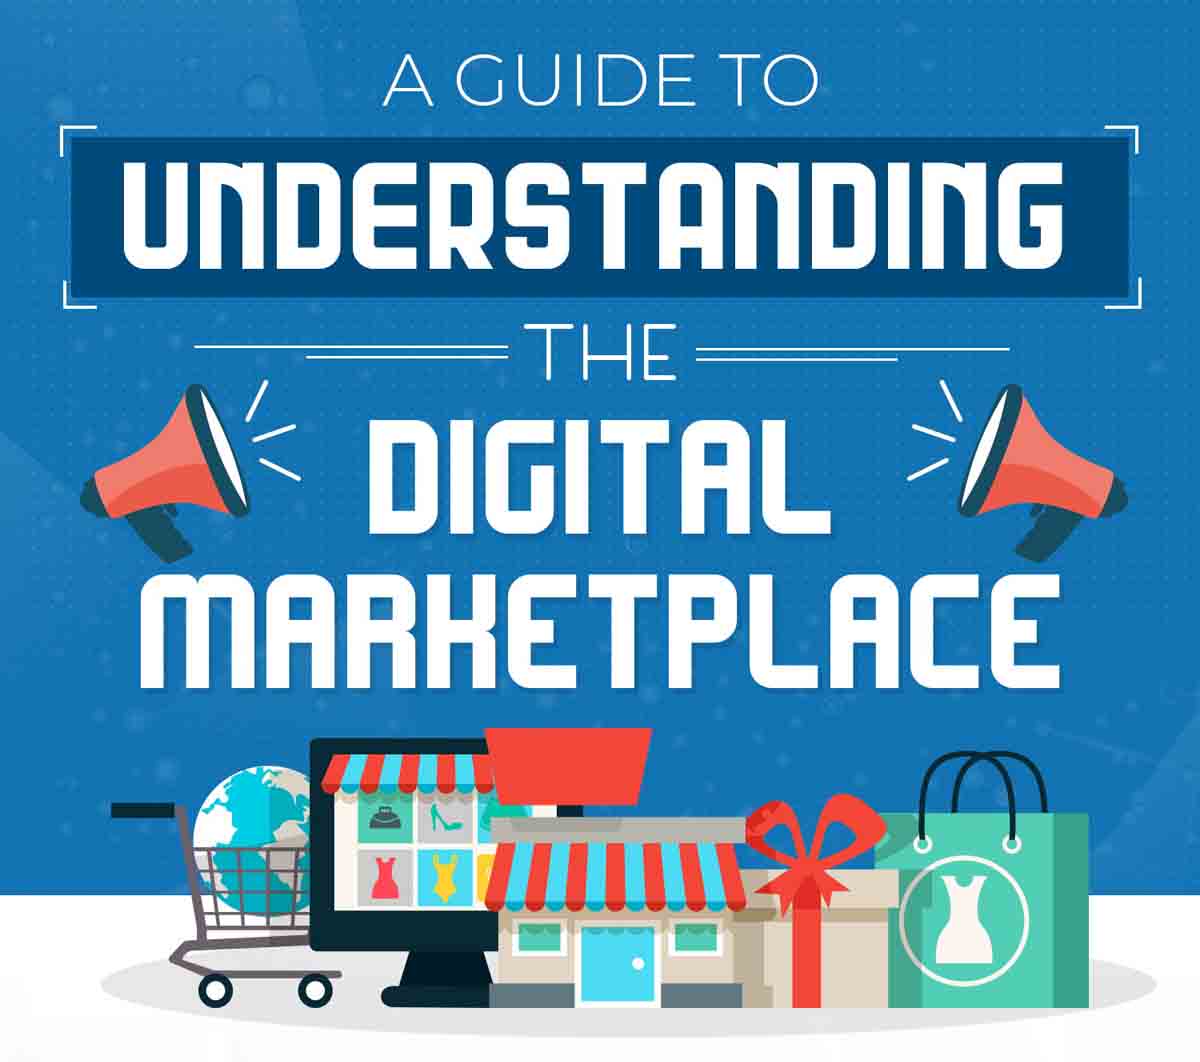
A Guide to Understanding the Digital Marketplace
Digital marketplaces are online platforms designed to sell an array of products and they can offer a broad range of items or specialize in a type of product. They are are convenient for consumers and benefit businesses because resources can be devoted to other areas instead of solely e-commerce, which can be very successful. When marketing products in a digital marketplace, it is important to take quality photos, invest in customer service, have clear policies, and utilize social media for marketing.

100 Years of Men’s Workwear
In this infographic, Woodhouse Clothing explores how men’s workwear has evolved in the past 100 years and how in the 80th anniversary year since the start of the Second World War, the fashion ration affected the trends and colors at the time. Revealing fashion truths, this infographic drills down the top trends for every decade since the 1910’s.

VMworld Through the Years Tour 2004-2019
VMworld is the premiere virtualization and cloud computing event held every year by VMware going back to 2004 when it kicked things off in San Diego. In 2019, the show returns to San Francisco after a three year run in Las Vegas. Come along as VMblog takes you on a tour of VMworld through the years, rock and roll style.

Dave Ramsey’s 7 Baby Steps to Achieve Financial Freedom
Do you like to save money? Do you want to live debt free? The following infographic features 7 steps recommended by Dave Ramsey that a person must take to achieve financial freedom. These steps will transform your finances, helping you go from being in debt to achieving financial freedom.
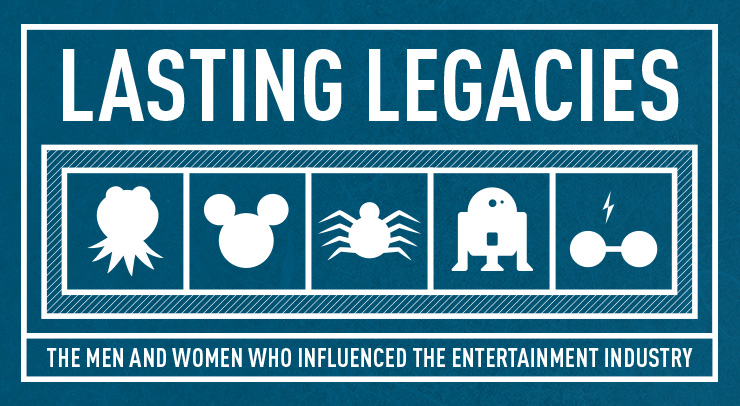
Lasting Legacies: The Men and Women Who Influenced the Entertainment Industry
It takes hundreds or even thousands of people to release a movie, a television series, a comic book series, etc.. Yet entertainment franchises are often guided by a singular artistic vision. In this infographic, HalloweenCostumes.com looks at five such visionaries: Jim Henson, Walt Disney, Stan Lee, George Lucas, and J.K. Rowling.
3 Guaranteed Ways to Prevent Your Kid’s Digital Addiction
Digital addiction is real and similar to drug and alcohol addiction. Unfortunately, children are getting addicted to digital screens as they play video games or watch videos for hours. Research shows that children who are exposed to more than an hour a day in front of digital screens, increase their suicidal thoughts by 72%, reduce their academic performance by 18% and it makes them more socially secluded.
How to Increase Online Store Sales With Product Reviews
In the world of eCommerce, gaining customer trust is vital as customer’s purchases can be heavily influenced by product ratings and reviews. More positive ratings and product reviews can mean more customers and ultimately, more revenue. In the following infographic, Cogneesol looks at how to increase online store sales with product reviews.
If It’s Broke DO Fix It: Why You Should Repair Your Broken Smartphones
Cell phones are a big part of everyday American life. However, broken smartphones happen all too often. You drop it, it falls out of your pocket, or maybe you knock it off the table. Now what? Learn why it’s smart to repair instead of replace in this infographic.
An Overview of Healthcare Insurance
Healthcare insurance in the United States can often be a tricky matter with many not understanding the basic vocabulary and statistics behind it. Uninformed views of it can cause people to buy improper services for themselves. This infographic seeks to inform viewers so they can make the right healthcare decision for themselves.
Binge Drinking Statistics
Alcohol is one of the most common substances used in the United States. The accessibility of alcohol makes it much easier for people of all ages and social classes to get their hands on. Binge drinking statistics in the US are alarming. These statistics reveal just how dangerous over-consumption of alcohol really is. In the following infographic, Crestview Recovery visualizes some binge drinking statistics.
A Guide to Understanding the Digital Marketplace
Digital marketplaces are online platforms designed to sell an array of products and they can offer a broad range of items or specialize in a type of product. They are are convenient for consumers and benefit businesses because resources can be devoted to other areas instead of solely e-commerce, which can be very successful. When marketing products in a digital marketplace, it is important to take quality photos, invest in customer service, have clear policies, and utilize social media for marketing.
100 Years of Men’s Workwear
In this infographic, Woodhouse Clothing explores how men’s workwear has evolved in the past 100 years and how in the 80th anniversary year since the start of the Second World War, the fashion ration affected the trends and colors at the time. Revealing fashion truths, this infographic drills down the top trends for every decade since the 1910’s.
VMworld Through the Years Tour 2004-2019
VMworld is the premiere virtualization and cloud computing event held every year by VMware going back to 2004 when it kicked things off in San Diego. In 2019, the show returns to San Francisco after a three year run in Las Vegas. Come along as VMblog takes you on a tour of VMworld through the years, rock and roll style.
Dave Ramsey’s 7 Baby Steps to Achieve Financial Freedom
Do you like to save money? Do you want to live debt free? The following infographic features 7 steps recommended by Dave Ramsey that a person must take to achieve financial freedom. These steps will transform your finances, helping you go from being in debt to achieving financial freedom.
Lasting Legacies: The Men and Women Who Influenced the Entertainment Industry
It takes hundreds or even thousands of people to release a movie, a television series, a comic book series, etc.. Yet entertainment franchises are often guided by a singular artistic vision. In this infographic, HalloweenCostumes.com looks at five such visionaries: Jim Henson, Walt Disney, Stan Lee, George Lucas, and J.K. Rowling.
Partners


Browse Archives By Category
Animated Infographics
Business Infographics
Career & Jobs Infographics
Education Infographics
Entertainment Industry Infographics
Environmental Infographics
Finance & Money Infographics
Food & Drink Infographics
Health Infographics
Historical Infographics
Home & Garden Infographics
Internet Infographics
Law and Legal Infographics
Lifestyle Infographics
Marketing Infographics
Offbeat Infographics
Parenting Infographics
Pets & Animals Infographics
Political Infographics
Shopping Infographics
Sports and Athletic Infographics
Technology Infographics
Transportation Infographics
Travel Infographics
Video Infographics