


Search 12,100+ Infographics!
Do I Need a Permit To Build a Deck?
A deck addition is a great investment and it has a good return. Outdoor living spaces are sought after, which can give you a competitive edge if you ever want to sell your house. A deck addition can increase functional outdoor living space, creating a place for spending time with family and friends. The following infographic looks to answer the question, “Do I Need a Permit To Build a Deck?”
When Should I Replace My Sump Pump?
A sump pump is an essential part of your home’s drainage system. It is a pump installed in the lowest part of the basement, used to pump out water that has collected in a basin. The sump basin is set up to collect any accumulating water that enters from drains that are part of the basement’s waterproofing system. The following infographic answers the question, “When Should I Replace My Sump Pump?”
Is The Gig Economy Jumping The Shark?
What’s keeping the gig economy alive now that some companies are experiencing 500% turnover? Learn more about the fate of the gig economy courtesy of this infographic from Online Schools Center.
How to Start an Overall Lifestyle Change
An overall lifestyle change is essential for getting back on track to be healthy. Having a healthy lifestyle is important because it reduces the risk of medical conditions, lowers stress levels, and leads to a longer life. In the following infographic, the team at Working Against Gravity looks at how to start an overall lifestyle change.
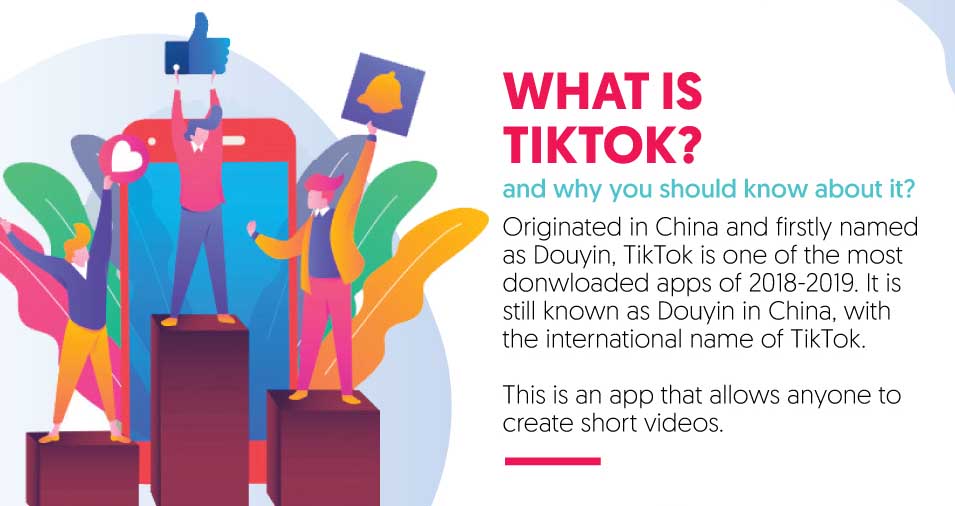
What Is TikTok?
TikTok is one of the world’s fast-growing social media and marketing platforms. It allows users to showcase short creative video to millions of people. TikTok is a multi-billion dollar platform which is suitable for influencer marketing. This social media channel is one of the best ways to showcase creativity to the world in the form of short and catchy video.
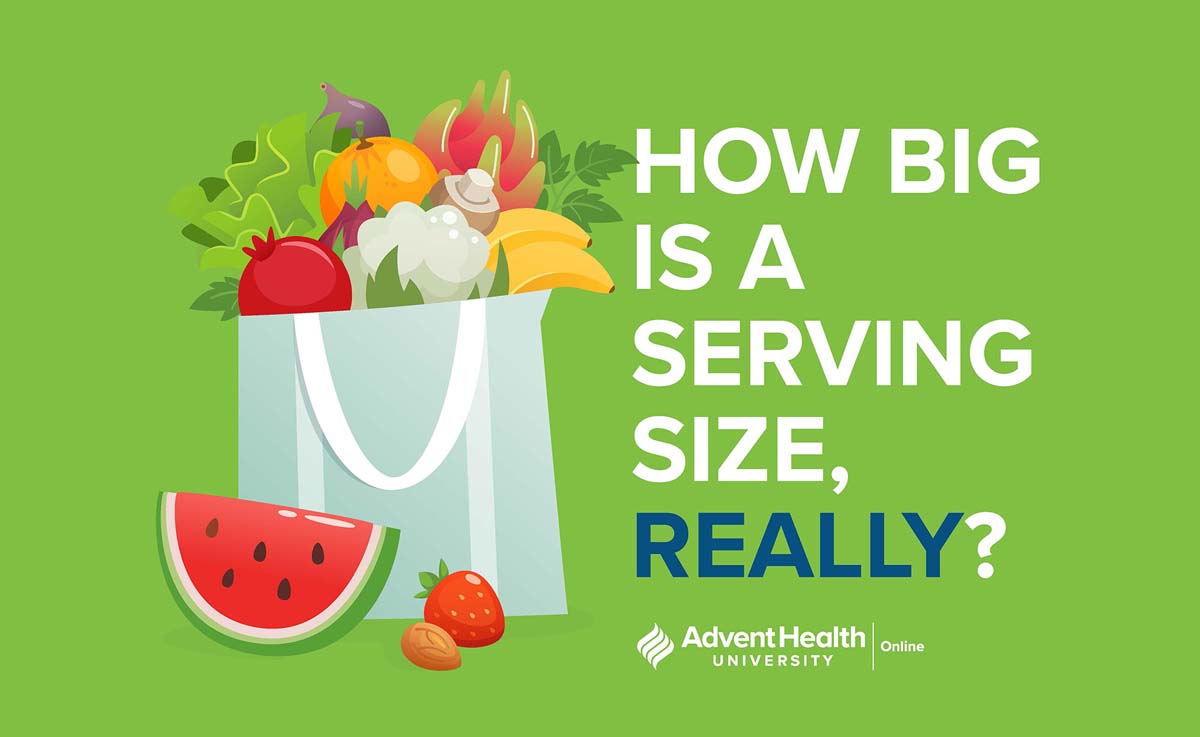
How Big Is a Serving Size, Really?
The calories listed on food packaging, as well as the amount of fats, sugars, and protein found in the food you’re about to eat can help you plan your meals for the day and help you reach your nutritional goals. But calories, fat, sugar, and protein amounts only tell you part of the story. The serving size listed on the nutrition facts tells you the rest. Learn more about serving sizes in this infographic.
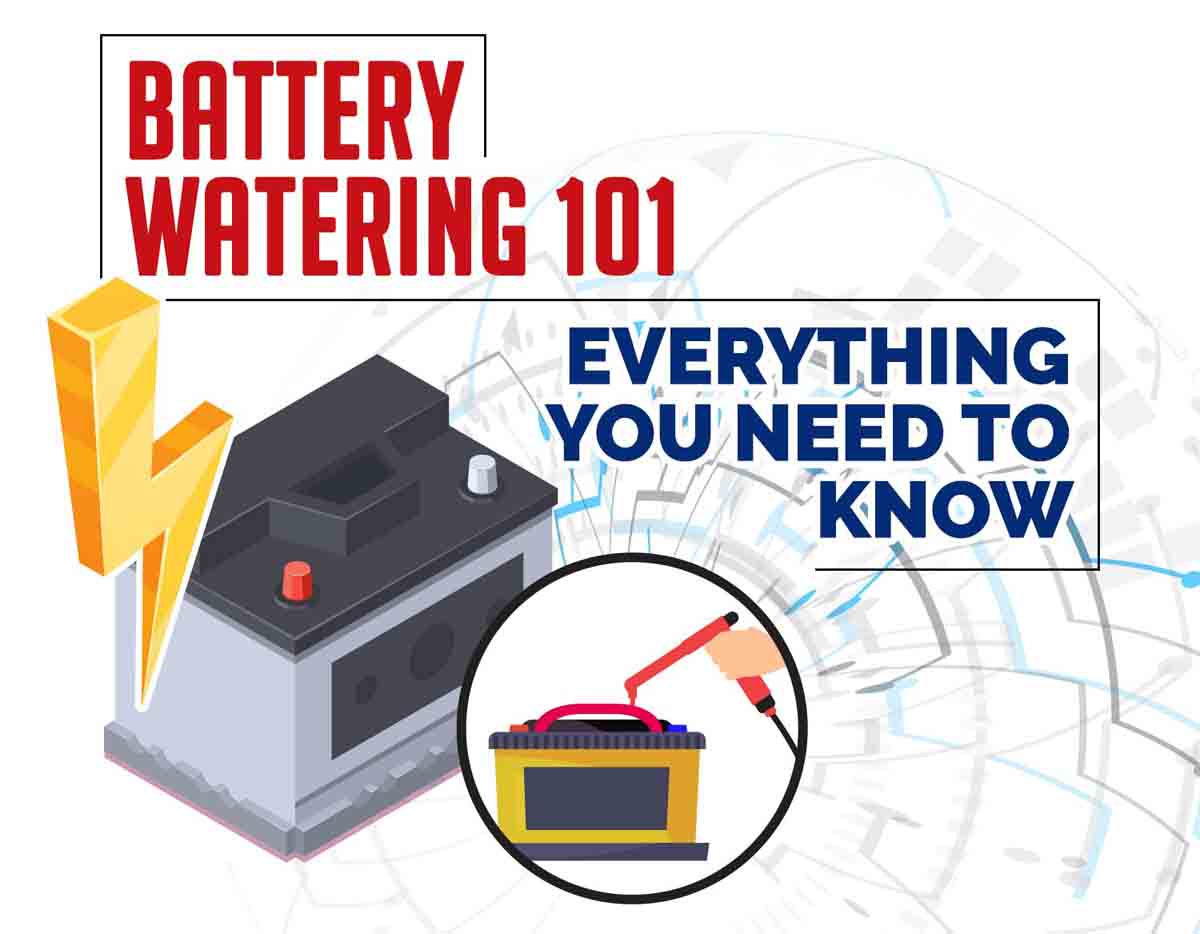
Battery Watering 101: Everything You Need to Know
Battery watering is the process used to replace the water levels in batteries. When the water levels drop due to evaporation and leaks, the battery’s water must be replaced to remove the risk of battery sulfation. Learn all about battery watering in this infographic.

Living in a Simulation – Augmented and Virtual Reality
Virtual and Augmented reality technology is so fascinating that we sometimes don’t feel that we are living in the real world. Virtual reality is made by the creation of an artificial environment and the user can interact with the surroundings, while Augmented reality is made by superimposing/overlaying artificial object in the real world. Augmented reality and virtual reality are explained lucidly through this Infographic
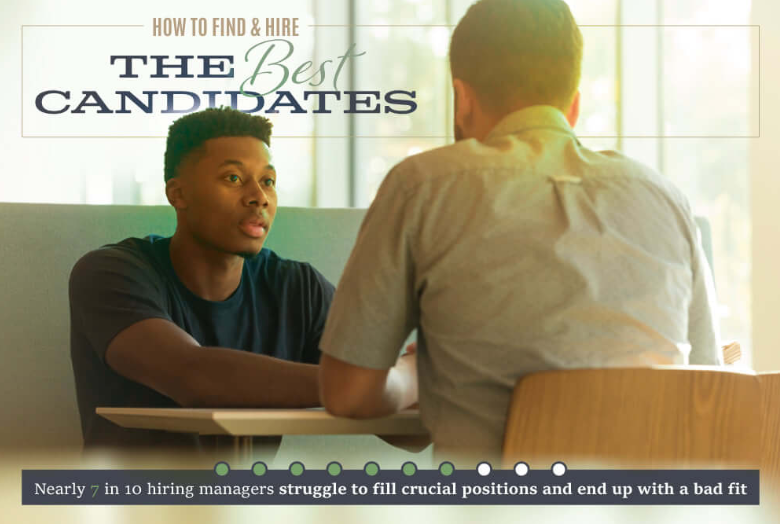
How To Find And Hire The Best Candidates
Hiring new people is never easy, and those old, crusty interview questions aren’t helping you any. Learn more about better interview techniques to build a better team courtesy of this infographic from Human Resources MBA.
Jean Care Hacks: Making Your Favorite Jeans Last
A favorite pair of jeans can be a closet staple. And when you finally find a pair with just the right fit, you hope they’ll last forever. But how to go about making them last as long as possible? Here are a few denim hacks that will help you prolong their lifespan.
Do I Need a Permit To Build a Deck?
A deck addition is a great investment and it has a good return. Outdoor living spaces are sought after, which can give you a competitive edge if you ever want to sell your house. A deck addition can increase functional outdoor living space, creating a place for spending time with family and friends. The following infographic looks to answer the question, “Do I Need a Permit To Build a Deck?”
When Should I Replace My Sump Pump?
A sump pump is an essential part of your home’s drainage system. It is a pump installed in the lowest part of the basement, used to pump out water that has collected in a basin. The sump basin is set up to collect any accumulating water that enters from drains that are part of the basement’s waterproofing system. The following infographic answers the question, “When Should I Replace My Sump Pump?”
Is The Gig Economy Jumping The Shark?
What’s keeping the gig economy alive now that some companies are experiencing 500% turnover? Learn more about the fate of the gig economy courtesy of this infographic from Online Schools Center.
How to Start an Overall Lifestyle Change
An overall lifestyle change is essential for getting back on track to be healthy. Having a healthy lifestyle is important because it reduces the risk of medical conditions, lowers stress levels, and leads to a longer life. In the following infographic, the team at Working Against Gravity looks at how to start an overall lifestyle change.
What Is TikTok?
TikTok is one of the world’s fast-growing social media and marketing platforms. It allows users to showcase short creative video to millions of people. TikTok is a multi-billion dollar platform which is suitable for influencer marketing. This social media channel is one of the best ways to showcase creativity to the world in the form of short and catchy video.
How Big Is a Serving Size, Really?
The calories listed on food packaging, as well as the amount of fats, sugars, and protein found in the food you’re about to eat can help you plan your meals for the day and help you reach your nutritional goals. But calories, fat, sugar, and protein amounts only tell you part of the story. The serving size listed on the nutrition facts tells you the rest. Learn more about serving sizes in this infographic.
Battery Watering 101: Everything You Need to Know
Battery watering is the process used to replace the water levels in batteries. When the water levels drop due to evaporation and leaks, the battery’s water must be replaced to remove the risk of battery sulfation. Learn all about battery watering in this infographic.
Living in a Simulation – Augmented and Virtual Reality
Virtual and Augmented reality technology is so fascinating that we sometimes don’t feel that we are living in the real world. Virtual reality is made by the creation of an artificial environment and the user can interact with the surroundings, while Augmented reality is made by superimposing/overlaying artificial object in the real world. Augmented reality and virtual reality are explained lucidly through this Infographic
How To Find And Hire The Best Candidates
Hiring new people is never easy, and those old, crusty interview questions aren’t helping you any. Learn more about better interview techniques to build a better team courtesy of this infographic from Human Resources MBA.
Jean Care Hacks: Making Your Favorite Jeans Last
A favorite pair of jeans can be a closet staple. And when you finally find a pair with just the right fit, you hope they’ll last forever. But how to go about making them last as long as possible? Here are a few denim hacks that will help you prolong their lifespan.
Partners


Browse Archives By Category
Animated Infographics
Business Infographics
Career & Jobs Infographics
Education Infographics
Entertainment Industry Infographics
Environmental Infographics
Finance & Money Infographics
Food & Drink Infographics
Health Infographics
Historical Infographics
Home & Garden Infographics
Internet Infographics
Law and Legal Infographics
Lifestyle Infographics
Marketing Infographics
Offbeat Infographics
Parenting Infographics
Pets & Animals Infographics
Political Infographics
Shopping Infographics
Sports and Athletic Infographics
Technology Infographics
Transportation Infographics
Travel Infographics
Video Infographics