


Search 12,100+ Infographics!

Advance Directives & Medical Powers of Attorney: Everything You Need to Know
Here is an infographic that provides a quick and easy way to learn about two important legal documents: a Medical Power of Attorney and an Advance Directive. The infographic starts by covering the basics of what the document is, who needs one, and why. Next, it helps the reader understand different sections of the document, and how to fill them out.

Hurricane Season Is Here – What You Need to Know to Prepare
Is there any storm system more terrifying or more destructive than a hurricane? With whipping winds and torrential downpours, flood damage and flying debris, hurricanes strike fear in property owners who live in coastal regions. Now that hurricane season is upon us, check out this infographic on what you need to know to prepare for hurricane season.

Casino Football – Customer Engagement Research
Here is an infographic that has been carefully created by the Casino Football team which provides insight into some of the basic customer research statistics for one of the UK’s established mobile and online casino operators. Due to GDPR restrictions, the Infographic has to omit detailed information.
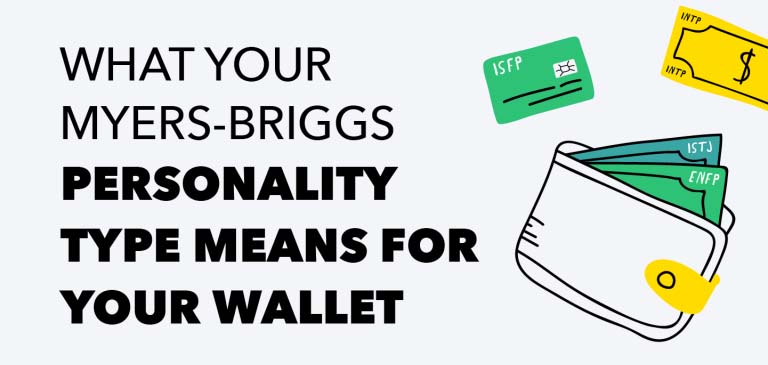
What Your Myers-Briggs Personality Type Means for Your Wallet
Personality tests are used to give us insights on how we perceive the world, how we interact with others, and how we make decisions. Whether you believe in them or not, personality tests are a big hit with relationship experts, teambuilders, and even employers. Knowing more about yourself and those around you can help you build more meaningful connections.

Why Should You Invest in Digital Marketing in Canada?
Did you know that digital ad formats are predicted to reach CA$8.80 billion in 2019? Mobile ad spending will also increase by 33.7% this year. Some more interesting facts regarding Canadian digital ad spends are mentioned in the following infographic, courtesy of Web Pro Marketing.

Dog Bite Statistics in Virginia
For many people, dogs are more than pets. They are like family members. Still, dogs are animals. They can attack and cause devastating injuries. They may bite people due to being startled, scared or threatened, or out of a need to protect themselves or their puppies, or even being overly excited or playful.

How To Get Rid of Mice?
If you are wondering what to do when you find out you have mice in your house or at your business, then here is an infographic from Pest Control in London with some top tips to help with your mouse problem. Learn where mice hide, how they get inside your home and some key tips for dealing with them.
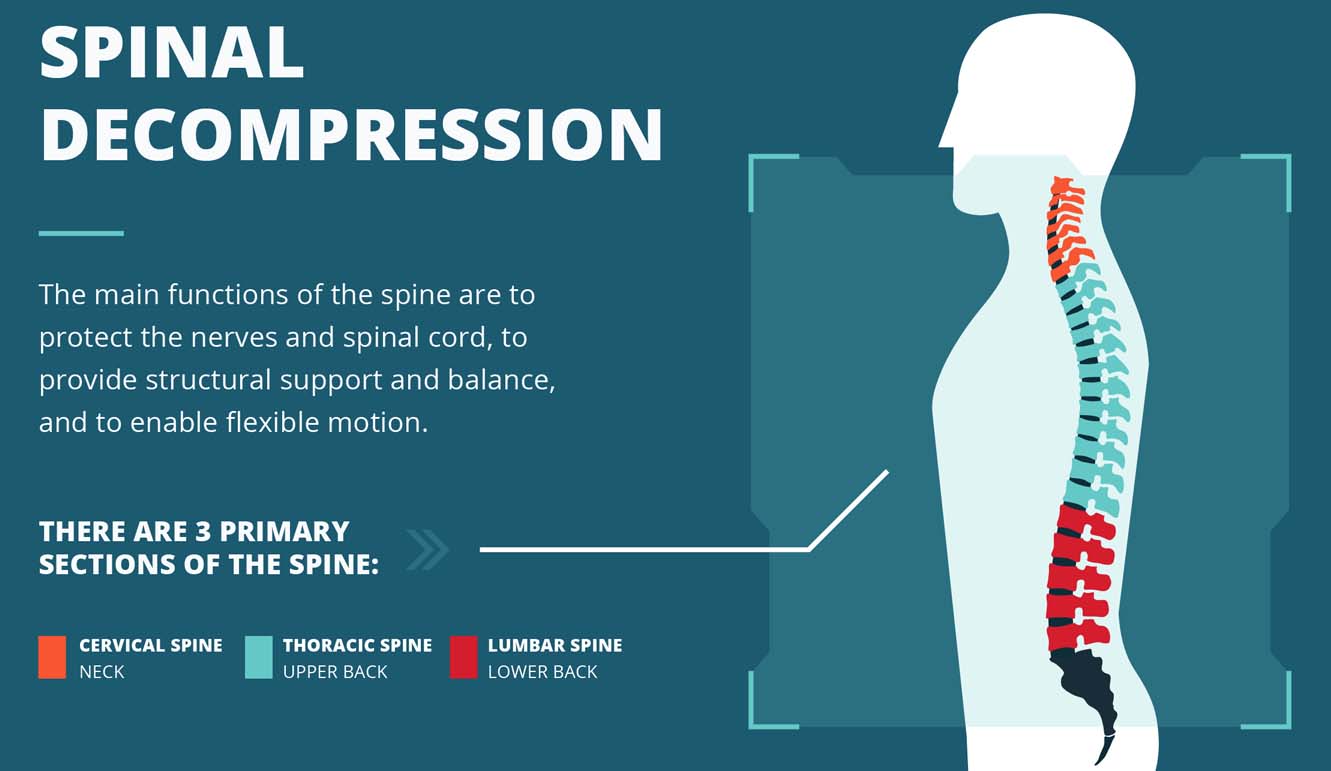
Spinal Decompression Therapy
Surgery or pain medications aren’t your only options if you’re suffering from chronic neck or back pain. In this infographic, courtesy of Preferred Injury Physicians, learn how chiropractors are using Spinal Decompression Therapy to provide natural pain relief to their patients.

Moldy Basement Causes
From water leaks to high humidity to improperly sealed windows, there are many causes for mold growth within your home’s basement. Symptoms typically include a distinct musty smell or, more seriously, health symptoms such as coughing, sore throat and wheezing. Learn about moldy basement causes in this infographic.

The Most Useful Keyboard Shortcut in macOS
Each macOS user spends a lot of time in the Finder application as the main file management tool. So it will not be superfluous to master some important tricks, thanks to which you will be able to achieve maximum productivity and spend less time on performing certain tasks. Here is an infographic of the most useful keyboard shortcuts in macOS.
Advance Directives & Medical Powers of Attorney: Everything You Need to Know
Here is an infographic that provides a quick and easy way to learn about two important legal documents: a Medical Power of Attorney and an Advance Directive. The infographic starts by covering the basics of what the document is, who needs one, and why. Next, it helps the reader understand different sections of the document, and how to fill them out.
Hurricane Season Is Here – What You Need to Know to Prepare
Is there any storm system more terrifying or more destructive than a hurricane? With whipping winds and torrential downpours, flood damage and flying debris, hurricanes strike fear in property owners who live in coastal regions. Now that hurricane season is upon us, check out this infographic on what you need to know to prepare for hurricane season.
Casino Football – Customer Engagement Research
Here is an infographic that has been carefully created by the Casino Football team which provides insight into some of the basic customer research statistics for one of the UK’s established mobile and online casino operators. Due to GDPR restrictions, the Infographic has to omit detailed information.
What Your Myers-Briggs Personality Type Means for Your Wallet
Personality tests are used to give us insights on how we perceive the world, how we interact with others, and how we make decisions. Whether you believe in them or not, personality tests are a big hit with relationship experts, teambuilders, and even employers. Knowing more about yourself and those around you can help you build more meaningful connections.
Why Should You Invest in Digital Marketing in Canada?
Did you know that digital ad formats are predicted to reach CA$8.80 billion in 2019? Mobile ad spending will also increase by 33.7% this year. Some more interesting facts regarding Canadian digital ad spends are mentioned in the following infographic, courtesy of Web Pro Marketing.
Dog Bite Statistics in Virginia
For many people, dogs are more than pets. They are like family members. Still, dogs are animals. They can attack and cause devastating injuries. They may bite people due to being startled, scared or threatened, or out of a need to protect themselves or their puppies, or even being overly excited or playful.
How To Get Rid of Mice?
If you are wondering what to do when you find out you have mice in your house or at your business, then here is an infographic from Pest Control in London with some top tips to help with your mouse problem. Learn where mice hide, how they get inside your home and some key tips for dealing with them.
Spinal Decompression Therapy
Surgery or pain medications aren’t your only options if you’re suffering from chronic neck or back pain. In this infographic, courtesy of Preferred Injury Physicians, learn how chiropractors are using Spinal Decompression Therapy to provide natural pain relief to their patients.
Moldy Basement Causes
From water leaks to high humidity to improperly sealed windows, there are many causes for mold growth within your home’s basement. Symptoms typically include a distinct musty smell or, more seriously, health symptoms such as coughing, sore throat and wheezing. Learn about moldy basement causes in this infographic.
The Most Useful Keyboard Shortcut in macOS
Each macOS user spends a lot of time in the Finder application as the main file management tool. So it will not be superfluous to master some important tricks, thanks to which you will be able to achieve maximum productivity and spend less time on performing certain tasks. Here is an infographic of the most useful keyboard shortcuts in macOS.
Partners


Browse Archives By Category
Animated Infographics
Business Infographics
Career & Jobs Infographics
Education Infographics
Entertainment Industry Infographics
Environmental Infographics
Finance & Money Infographics
Food & Drink Infographics
Health Infographics
Historical Infographics
Home & Garden Infographics
Internet Infographics
Law and Legal Infographics
Lifestyle Infographics
Marketing Infographics
Offbeat Infographics
Parenting Infographics
Pets & Animals Infographics
Political Infographics
Shopping Infographics
Sports and Athletic Infographics
Technology Infographics
Transportation Infographics
Travel Infographics
Video Infographics