


Search 12,100+ Infographics!
Florida Marijuana Laws: 5 Medical Marijuana Card Facts
Florida marijuana laws surrounding medical and recreational use can be confusing. Check out this infographic from THC Physicians to learn 5 very important facts about Florida medical marijuana and recreational use.
What Does GDPR Mean For IT Service Management?
Explore this infographic to get a quick overview of GDPR, its key concepts in the ITSM context, and the aspects of ITSM it influences. Take advantage of insights on service desk features that could help IT service desk teams implement privacy policies, and also some actionable takeaways.

Rundown: The Google Ad Grant Essentials
The Google Ad Grant program offers $10,000 worth of free advertising to nonprofits The following infographic, courtesy of Elevation, breaks down the basics of what the Google Ad Grant is, how to apply, and how to remain eligible after receiving the grant.
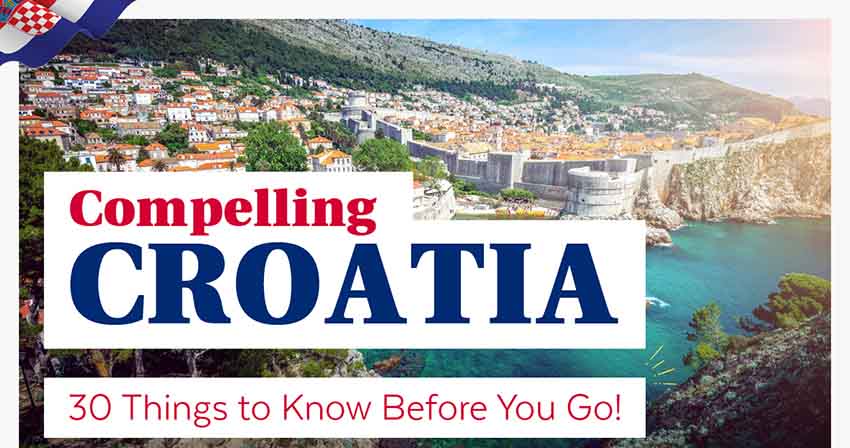
Compelling Croatia – 30 Things to Know Before You Go
Not everyone has the time to read up before they set off on their holidays. That’s why the team at Travel Department have created the following infographic which is designed to save you time on research so you’ll have more time at the beach.
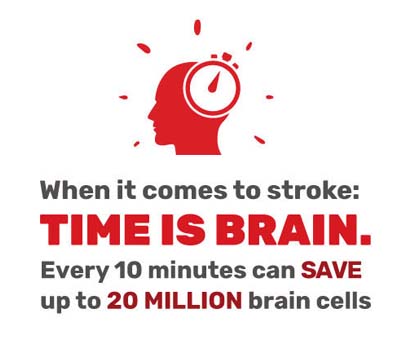
Suspect Stroke? Calling 911 Can Make a Difference
In the United States, stroke is the 5th leading cause of death and affects more than 795,000 people each year. When it comes to stroke, time is brain. Every hour a stroke goes untreated, the brain loses up to four years of age. That’s why it’s crucial to call 911 and seek immediate medical attention at the first sign of stroke. The signs of stroke can be subtle and hard to recognize. Educate yourself and others to BE FAST and act with urgency.

When Social Media Meets Video
Video consumption on social media has rapidly grown, and without a social media video content strategy, you might miss all the perks. Social media videos generate up to 1200% more shares than texts and images combined. Social networks are meant to be for shared experiences. And videos convey more emotions that texts and images combined. That’s solely the reason why people can’t get enough of videos on social media.
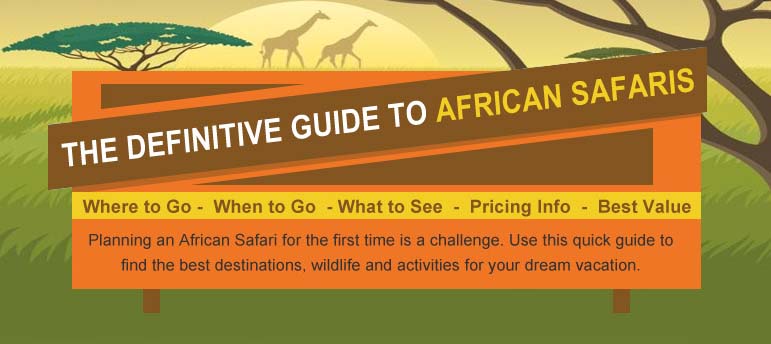
The Definitive Guide to African Safaris
Whether it’s your first time or if you’re a seasoned traveler, planning an African Safari Holiday can be a daunting task, mostly due to the wide variety of options available. This handy infographic from African Safari Home gives you a quick guide reviewing the Top 6 countries to visit, when to go and what animals and activities you can expect on your stay.
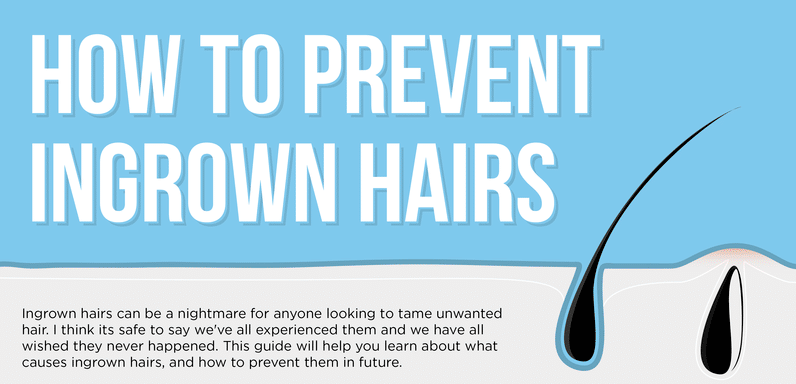
How to Prevent Ingrown Hairs
Nobody likes an in-grown hair. They can produce unsightly blemishes and can also be quite painful! Here is a guide from A Smooth Life that will help learn how to get rid of ingrown hair, keep them from happening, and how to make sure you don’t make them worse once you spot one.
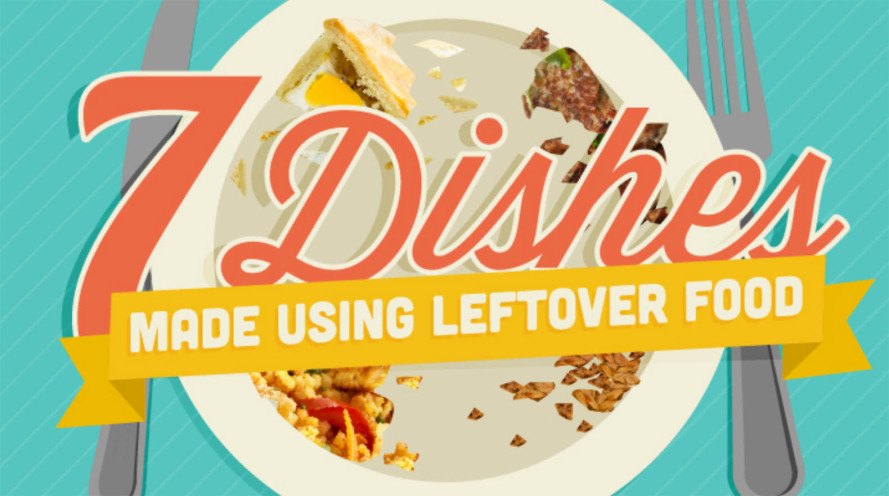
7 Dishes Made Using Leftover Food
“People throw away food because it is not big enough part of their income,” says Henry Dimbleby, co-founder of the healthy U.K. fast-food chain Leon. Because many people forget the value of food, they perhaps don;t realize how much they throw away every day. This infographic gives you 7 great dishes that you can make using leftover food to help reduce food waste
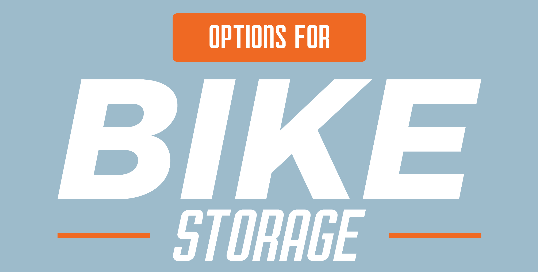
15 Amazing Options For Bike Storage Inside and Outside
A great number of households have bicycles, from road bikes, standard mountain bikes to kid’s bikes. Some families use them every day, others rarely use them. For bike riders, storing bikes in tight quarters can be an invitation for all sorts of potential problems. In this infographic, discover 15 options for bike storage inside and outside your home.
Florida Marijuana Laws: 5 Medical Marijuana Card Facts
Florida marijuana laws surrounding medical and recreational use can be confusing. Check out this infographic from THC Physicians to learn 5 very important facts about Florida medical marijuana and recreational use.
What Does GDPR Mean For IT Service Management?
Explore this infographic to get a quick overview of GDPR, its key concepts in the ITSM context, and the aspects of ITSM it influences. Take advantage of insights on service desk features that could help IT service desk teams implement privacy policies, and also some actionable takeaways.
Rundown: The Google Ad Grant Essentials
The Google Ad Grant program offers $10,000 worth of free advertising to nonprofits The following infographic, courtesy of Elevation, breaks down the basics of what the Google Ad Grant is, how to apply, and how to remain eligible after receiving the grant.
Compelling Croatia – 30 Things to Know Before You Go
Not everyone has the time to read up before they set off on their holidays. That’s why the team at Travel Department have created the following infographic which is designed to save you time on research so you’ll have more time at the beach.
Suspect Stroke? Calling 911 Can Make a Difference
In the United States, stroke is the 5th leading cause of death and affects more than 795,000 people each year. When it comes to stroke, time is brain. Every hour a stroke goes untreated, the brain loses up to four years of age. That’s why it’s crucial to call 911 and seek immediate medical attention at the first sign of stroke. The signs of stroke can be subtle and hard to recognize. Educate yourself and others to BE FAST and act with urgency.
When Social Media Meets Video
Video consumption on social media has rapidly grown, and without a social media video content strategy, you might miss all the perks. Social media videos generate up to 1200% more shares than texts and images combined. Social networks are meant to be for shared experiences. And videos convey more emotions that texts and images combined. That’s solely the reason why people can’t get enough of videos on social media.
The Definitive Guide to African Safaris
Whether it’s your first time or if you’re a seasoned traveler, planning an African Safari Holiday can be a daunting task, mostly due to the wide variety of options available. This handy infographic from African Safari Home gives you a quick guide reviewing the Top 6 countries to visit, when to go and what animals and activities you can expect on your stay.
How to Prevent Ingrown Hairs
Nobody likes an in-grown hair. They can produce unsightly blemishes and can also be quite painful! Here is a guide from A Smooth Life that will help learn how to get rid of ingrown hair, keep them from happening, and how to make sure you don’t make them worse once you spot one.
7 Dishes Made Using Leftover Food
“People throw away food because it is not big enough part of their income,” says Henry Dimbleby, co-founder of the healthy U.K. fast-food chain Leon. Because many people forget the value of food, they perhaps don;t realize how much they throw away every day. This infographic gives you 7 great dishes that you can make using leftover food to help reduce food waste
15 Amazing Options For Bike Storage Inside and Outside
A great number of households have bicycles, from road bikes, standard mountain bikes to kid’s bikes. Some families use them every day, others rarely use them. For bike riders, storing bikes in tight quarters can be an invitation for all sorts of potential problems. In this infographic, discover 15 options for bike storage inside and outside your home.
Partners


Browse Archives By Category
Animated Infographics
Business Infographics
Career & Jobs Infographics
Education Infographics
Entertainment Industry Infographics
Environmental Infographics
Finance & Money Infographics
Food & Drink Infographics
Health Infographics
Historical Infographics
Home & Garden Infographics
Internet Infographics
Law and Legal Infographics
Lifestyle Infographics
Marketing Infographics
Offbeat Infographics
Parenting Infographics
Pets & Animals Infographics
Political Infographics
Shopping Infographics
Sports and Athletic Infographics
Technology Infographics
Transportation Infographics
Travel Infographics
Video Infographics