


Search 12,100+ Infographics!
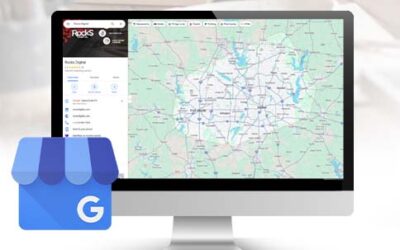
Maximizing Your Google Business Profile
A well-optimized Google Business Profile (GBP) is essential for local SEO, driving visibility in local search results and the local pack. Rocks Digital offers insights into effective GBP management through a detailed infographic, highlighting optimization steps and common pitfalls for businesses to avoid.

Small Businesses Most Impacted by Natural Disasters by State
The team at Ooma highlighted a specific facet of natural disasters by performing a study that examines how many natural disaster relief loans are available per state. This serves as an interesting way to map out where natural disasters take the greatest toll at the highest cost.
The Most Dangerous States for Boating Deaths
Boating is a fun pastime that gets people outside and on the water for fresh air and exercise. Unfortunately, boating can come with a lot of risks. The team at SI Yachts maps out the most dangerous states in the country based on the number of boating deaths per boating registration.

America’s Most Valuable Companies Ranked by Profit per Employee
The success of a company largely relies on the efficiency and knowledge of its employees. This is why profit per employee is such an important metric of success. Companies use this calculation to judge the performance and productivity of their workers.

25 U.S. Hospitals With the Most Emergency Room Visits Per Hour
ER patient numbers can strain the resources of the hospital staff. It’s a problem if an ER habitually has a high volume of patients. Here is a map created by the team at NY Requirements that highlights the ERs with the highest volumes of patients.
The Most Playful Cities in the United States
The team at AAA State of Play presents a new way to judge American cities with this map ranking them by playfulness. Playfulness is defined by 10 factors that included the number of parks, playgrounds, and children’s museums, along with other things that make a city fun and child-friendly.

Heroin Addiction & Its Dangers: What You Need to Know & Treatment Options
Heroin, a highly addictive opioid drug, has plagued societies for over a century. Derived from morphine, a natural substance extracted from opium poppies, heroin has a long and destructive history. Its potent effects and accessibility have contributed to widespread addiction and overdose deaths. This infographic delves into the origins of heroin, its rise in popularity, and the alarming statistics surrounding its use in the U.S.

Meditation and Yoga for Rehab: Ancient Practices, Modern Applications
Meditation and yoga, often associated with esoteric practices, are ancient techniques that have been used for centuries to enhance physical, mental, and spiritual well-being. Originating in Eastern cultures, these practices have gradually gained acceptance in Western society and are now recognized as effective therapeutic tools.

The History of Cannabis and the Advances in Testing
Cannabis has been used by humans for millennia. Its origins trace back to ancient civilizations who valued it for its medicinal, spiritual, and recreational properties. Here is an infographic that delves into the historical journey of cannabis, its cultural significance, and the evolution of cannabis testing.

Finding the Right HR Tech PR Agency
HR tech is disrupting modern day hiring as we know it. Shouldn’t your PR shop do the same? When it comes to the finer nuances of understanding the world of HR tech, not all PR shops are alike. Make sure that you have a domain expert that knows the ropes.
Maximizing Your Google Business Profile
A well-optimized Google Business Profile (GBP) is essential for local SEO, driving visibility in local search results and the local pack. Rocks Digital offers insights into effective GBP management through a detailed infographic, highlighting optimization steps and common pitfalls for businesses to avoid.
Small Businesses Most Impacted by Natural Disasters by State
The team at Ooma highlighted a specific facet of natural disasters by performing a study that examines how many natural disaster relief loans are available per state. This serves as an interesting way to map out where natural disasters take the greatest toll at the highest cost.
The Most Dangerous States for Boating Deaths
Boating is a fun pastime that gets people outside and on the water for fresh air and exercise. Unfortunately, boating can come with a lot of risks. The team at SI Yachts maps out the most dangerous states in the country based on the number of boating deaths per boating registration.
America’s Most Valuable Companies Ranked by Profit per Employee
The success of a company largely relies on the efficiency and knowledge of its employees. This is why profit per employee is such an important metric of success. Companies use this calculation to judge the performance and productivity of their workers.
25 U.S. Hospitals With the Most Emergency Room Visits Per Hour
ER patient numbers can strain the resources of the hospital staff. It’s a problem if an ER habitually has a high volume of patients. Here is a map created by the team at NY Requirements that highlights the ERs with the highest volumes of patients.
The Most Playful Cities in the United States
The team at AAA State of Play presents a new way to judge American cities with this map ranking them by playfulness. Playfulness is defined by 10 factors that included the number of parks, playgrounds, and children’s museums, along with other things that make a city fun and child-friendly.
Heroin Addiction & Its Dangers: What You Need to Know & Treatment Options
Heroin, a highly addictive opioid drug, has plagued societies for over a century. Derived from morphine, a natural substance extracted from opium poppies, heroin has a long and destructive history. Its potent effects and accessibility have contributed to widespread addiction and overdose deaths. This infographic delves into the origins of heroin, its rise in popularity, and the alarming statistics surrounding its use in the U.S.
Meditation and Yoga for Rehab: Ancient Practices, Modern Applications
Meditation and yoga, often associated with esoteric practices, are ancient techniques that have been used for centuries to enhance physical, mental, and spiritual well-being. Originating in Eastern cultures, these practices have gradually gained acceptance in Western society and are now recognized as effective therapeutic tools.
The History of Cannabis and the Advances in Testing
Cannabis has been used by humans for millennia. Its origins trace back to ancient civilizations who valued it for its medicinal, spiritual, and recreational properties. Here is an infographic that delves into the historical journey of cannabis, its cultural significance, and the evolution of cannabis testing.
Finding the Right HR Tech PR Agency
HR tech is disrupting modern day hiring as we know it. Shouldn’t your PR shop do the same? When it comes to the finer nuances of understanding the world of HR tech, not all PR shops are alike. Make sure that you have a domain expert that knows the ropes.
Partners


Browse Archives By Category
Animated Infographics
Business Infographics
Career & Jobs Infographics
Education Infographics
Entertainment Industry Infographics
Environmental Infographics
Finance & Money Infographics
Food & Drink Infographics
Health Infographics
Historical Infographics
Home & Garden Infographics
Internet Infographics
Law and Legal Infographics
Lifestyle Infographics
Marketing Infographics
Offbeat Infographics
Parenting Infographics
Pets & Animals Infographics
Political Infographics
Shopping Infographics
Sports and Athletic Infographics
Technology Infographics
Transportation Infographics
Travel Infographics
Video Infographics