


Search 12,000+ Infographics!

Fiberglass Pipe: Water Infrastructure of the Future
When it comes to the importance of critical water pipe infrastructure – if people don’t have water, nothing else matters. That’s why organizations such as Hobas Pipe are working hard to evolve to the next level of fiberglass pipe for clean water for all. Learn more about fiberglass pipe in the following infographic.

The Power of COO Coaching
The COO or Second in Command is the glue that holds together most operations of many major businesses. There is much ado about the CEO, but smart organizations invest heavily in the career progress of their COO’s as well. Learn more about the important work behind COO coaching in the infographic below.

Student Success: A Story in the Making
What does student success look like in Kentucky? Advocacy organizations are working hard to up the game for the future of higher education. Learn more in the infographic below, courtesy of the Kentucky Student Success Collaborative.

How Can More People Get Credit? Alternative Data
Equifax is looking to change the game of credit scoring. How? By utilizing alternative data such as utility bills. This will create a more level playing field to help people achieve their dreams. Learn more in the following infographic.

Visualizing the Most Popular Bully Breeds
Bully breeds are among the most popular dog breeds in the USA. Learn more about what makes these dogs so loveable in the infographic below, courtesy of Bully Max.
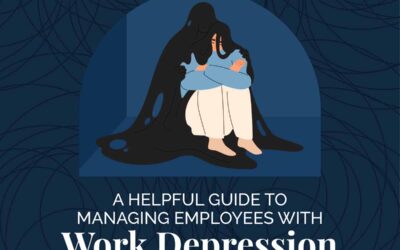
A Helpful Guide to Managing Employees With Work Depression
Managing employees with work depression is a vital responsibility for employers, impacting the affected individuals and the overall workplace environment. Work depression can significantly lower productivity, morale, and job satisfaction, creating a ripple effect throughout the organization. Here is an infographic that will help guide you in properly managing employees suffering from depression at work.

A Compendium of the Most Iconic Artificial Intelligence From Fiction
AI is all over the headlines these days. There is a long history of science fiction featuring the benefits of consequences of introducing AI to a future society. Now that the future is here, this fascinating compendium from AIPRM gives us a look at the ways we’ve imagined AI over the decades.
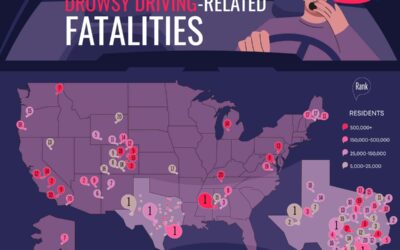
The Deadliest U.S. Counties for Drowsy Driving-Related Fatalities
Every year, drowsy driving is one of the leading causes of driving-related deaths. Many people are on long drives and get drowsy while others get behind the wheel in a less than alert state and despite good intentions, they cause an accident. The team at Naplab has created the following visual which displays the counties with the highest percentage of drowsy driving fatalities relative to the population.
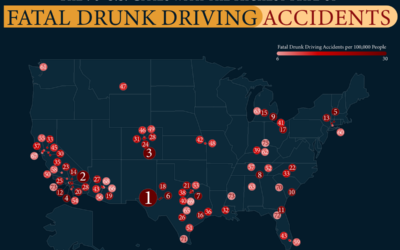
75 U.S. Cities with the Highest Rate of Fatal Drunk Driving Accidents
Every year at holidays and festivals, we’re reminded that drunk driving can have fatal consequences. The team at MTVLaw decided to paint a dire picture of how serious this problem is with a map of which cities have the most drunk driving fatalities. Odessa, Texas is on the top of the list. Between 2018 and 2022, this city recorded 31 fatal drunk driving accidents.

U.S. Cities With the Highest and Lowest Divorce Rates
Divorce is common in the United States and many people research what factors might play into the rates of divorce in America. The team at LLCAttorney.com did their part by researching which cities have the highest and lowest rates of divorce, using estimates 1-year post marriage based on U.S. Census data from 2022.
Fiberglass Pipe: Water Infrastructure of the Future
When it comes to the importance of critical water pipe infrastructure – if people don’t have water, nothing else matters. That’s why organizations such as Hobas Pipe are working hard to evolve to the next level of fiberglass pipe for clean water for all. Learn more about fiberglass pipe in the following infographic.
The Power of COO Coaching
The COO or Second in Command is the glue that holds together most operations of many major businesses. There is much ado about the CEO, but smart organizations invest heavily in the career progress of their COO’s as well. Learn more about the important work behind COO coaching in the infographic below.
Student Success: A Story in the Making
What does student success look like in Kentucky? Advocacy organizations are working hard to up the game for the future of higher education. Learn more in the infographic below, courtesy of the Kentucky Student Success Collaborative.
How Can More People Get Credit? Alternative Data
Equifax is looking to change the game of credit scoring. How? By utilizing alternative data such as utility bills. This will create a more level playing field to help people achieve their dreams. Learn more in the following infographic.
Visualizing the Most Popular Bully Breeds
Bully breeds are among the most popular dog breeds in the USA. Learn more about what makes these dogs so loveable in the infographic below, courtesy of Bully Max.
A Helpful Guide to Managing Employees With Work Depression
Managing employees with work depression is a vital responsibility for employers, impacting the affected individuals and the overall workplace environment. Work depression can significantly lower productivity, morale, and job satisfaction, creating a ripple effect throughout the organization. Here is an infographic that will help guide you in properly managing employees suffering from depression at work.
A Compendium of the Most Iconic Artificial Intelligence From Fiction
AI is all over the headlines these days. There is a long history of science fiction featuring the benefits of consequences of introducing AI to a future society. Now that the future is here, this fascinating compendium from AIPRM gives us a look at the ways we’ve imagined AI over the decades.
The Deadliest U.S. Counties for Drowsy Driving-Related Fatalities
Every year, drowsy driving is one of the leading causes of driving-related deaths. Many people are on long drives and get drowsy while others get behind the wheel in a less than alert state and despite good intentions, they cause an accident. The team at Naplab has created the following visual which displays the counties with the highest percentage of drowsy driving fatalities relative to the population.
75 U.S. Cities with the Highest Rate of Fatal Drunk Driving Accidents
Every year at holidays and festivals, we’re reminded that drunk driving can have fatal consequences. The team at MTVLaw decided to paint a dire picture of how serious this problem is with a map of which cities have the most drunk driving fatalities. Odessa, Texas is on the top of the list. Between 2018 and 2022, this city recorded 31 fatal drunk driving accidents.
U.S. Cities With the Highest and Lowest Divorce Rates
Divorce is common in the United States and many people research what factors might play into the rates of divorce in America. The team at LLCAttorney.com did their part by researching which cities have the highest and lowest rates of divorce, using estimates 1-year post marriage based on U.S. Census data from 2022.
Partners


Browse Archives By Category
Animated Infographics
Business Infographics
Career & Jobs Infographics
Education Infographics
Entertainment Industry Infographics
Environmental Infographics
Finance & Money Infographics
Food & Drink Infographics
Health Infographics
Historical Infographics
Home & Garden Infographics
Internet Infographics
Law and Legal Infographics
Lifestyle Infographics
Marketing Infographics
Offbeat Infographics
Parenting Infographics
Pets & Animals Infographics
Political Infographics
Shopping Infographics
Sports and Athletic Infographics
Technology Infographics
Transportation Infographics
Travel Infographics
Video Infographics