


Search 12,100+ Infographics!
Role of IOT in the ERP Industry
The Internet of Things (IoT) will create more enhancements in the enterprise resource planning system. Machine interaction opens up many opportunities in the business management sector. As ERP tools are closely related with the business management operations, IoT will play a futuristic role in the business development procedures such as operation enhancement, finding precise locations, speed up the productivity, and better analytics capability.

A Step-by-Step Guide to Creating Your Lead Generation Funnel
The most critical part of any business development strategy is to establish how the business will generate leads. This infographic will give you invaluable insights that will help you understand the lead generation process as well as an overview on tips and best practices to creating your lead generation funnel.

How Tech Giants Make Their Billions
Collectively, the five largest tech companies generate over 800 billion in revenue each year, making them bigger than for example Saudi Arabia’s entire economy! But just how do each of these companies make their money? This infographic explores this in detail.

10 Travel Safety Tips Every Executive Should Know
Traveling for business is an effective tool to expand your market reach as well as forge formidable relationships with your business partners around the globe. However, to ensure the success of your trip, you need to plan it thoroughly. Business traveling is not always an easy task, as you will face some health and safety issues while on the road.

How To Hook A Minnow
Minnows are the most effective baitfish. But, how you hook a minnow is what determines the success of getting a bite. When hooked correctly, minnows can make your fishing expedition worthwhile. In the following infographic, Honest Fishers shares some step by step procedures on how to hook a minnow.
How Your Mom & Pop Shop Can Succeed Against Big Retailers
The following infographic by Fundera debunks mom-and-pop shop myths and gives helpful tips to help small business owners thrive against big retailers. For instance, did you know that 98% of Gen Zers prefer an in-store shopping experience? Read on to see how your mom and pop shop can succeed against big retailers.

Why is Email the Most Common Business Communication Medium?
Despite social media gaining popularity, email still remains one of the most popular communication mediums. In fact, most professionals prefer email as a business communication medium. When you look in to the details, you will notice that the world wide email usage is...
6 Challenges Financial Marketers Must Overcome to Boost Digital Customer Engagement
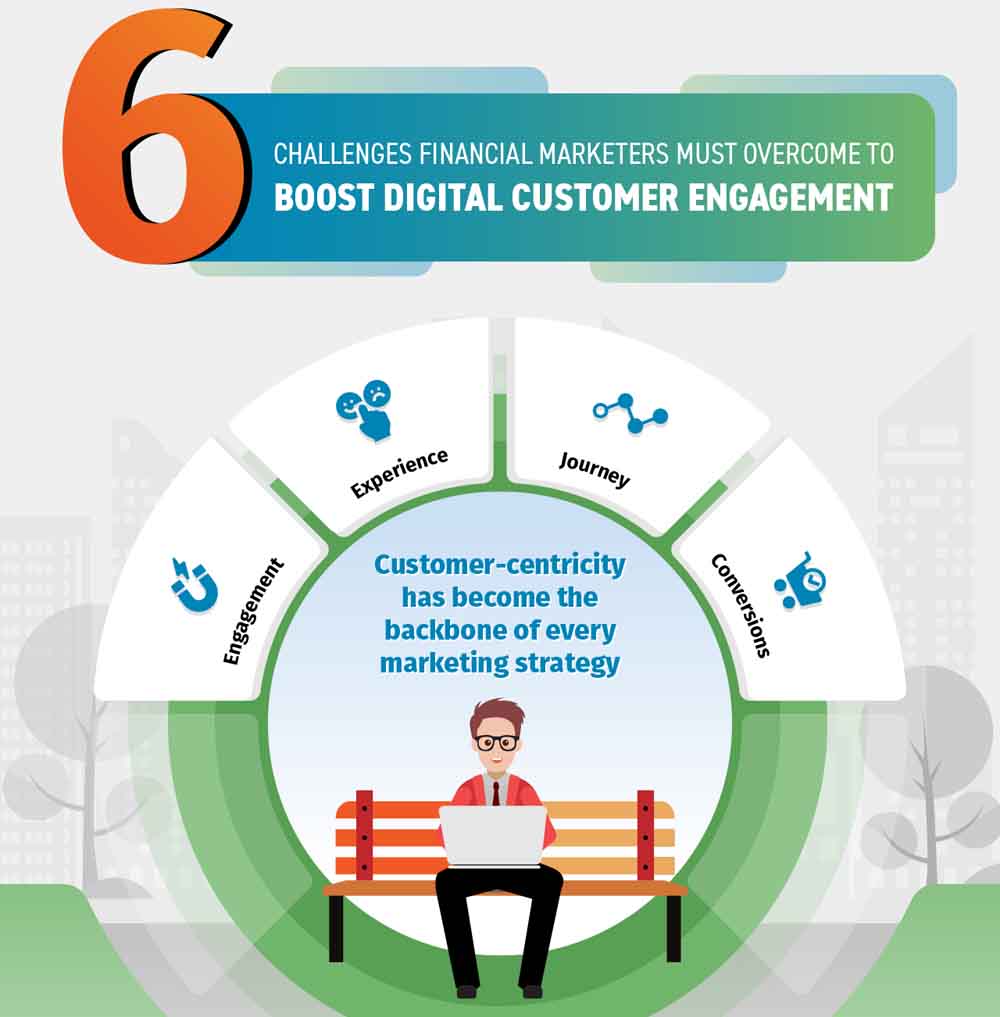
Financial marketers are tasked with the job of providing a rich customer experience overall digital channels. They are looking to implement new digital technologies into their business models that could help them engage customers on a much deeper level. The richer the experience, the better is the customer engagement and subsequently, conversions.

A Vape Travelers Guide to International Vaping Laws
Travelers need to be aware that regulations for vaping vary significantly from country to country and if vacationing overseas you need to know the rules of the countries you plan to visit before you leave. Learn all about international vaping laws in this infographic.

60 Unique Ways to Lace Your Shoes
When jogging or running, there are multiple variables that determine the fit and comfort of the shoes you are wearing. Regardless of whether your shoes feel incredible amid your first attempt, there could be times that the upper development will annoy on your foot. Each pair of feet is novel, which is the reason utilizing the correct lacing technique is matter in your running execution.
Role of IOT in the ERP Industry
The Internet of Things (IoT) will create more enhancements in the enterprise resource planning system. Machine interaction opens up many opportunities in the business management sector. As ERP tools are closely related with the business management operations, IoT will play a futuristic role in the business development procedures such as operation enhancement, finding precise locations, speed up the productivity, and better analytics capability.
A Step-by-Step Guide to Creating Your Lead Generation Funnel
The most critical part of any business development strategy is to establish how the business will generate leads. This infographic will give you invaluable insights that will help you understand the lead generation process as well as an overview on tips and best practices to creating your lead generation funnel.
How Tech Giants Make Their Billions
Collectively, the five largest tech companies generate over 800 billion in revenue each year, making them bigger than for example Saudi Arabia’s entire economy! But just how do each of these companies make their money? This infographic explores this in detail.
10 Travel Safety Tips Every Executive Should Know
Traveling for business is an effective tool to expand your market reach as well as forge formidable relationships with your business partners around the globe. However, to ensure the success of your trip, you need to plan it thoroughly. Business traveling is not always an easy task, as you will face some health and safety issues while on the road.
How To Hook A Minnow
Minnows are the most effective baitfish. But, how you hook a minnow is what determines the success of getting a bite. When hooked correctly, minnows can make your fishing expedition worthwhile. In the following infographic, Honest Fishers shares some step by step procedures on how to hook a minnow.
How Your Mom & Pop Shop Can Succeed Against Big Retailers
The following infographic by Fundera debunks mom-and-pop shop myths and gives helpful tips to help small business owners thrive against big retailers. For instance, did you know that 98% of Gen Zers prefer an in-store shopping experience? Read on to see how your mom and pop shop can succeed against big retailers.
Why is Email the Most Common Business Communication Medium?
Despite social media gaining popularity, email still remains one of the most popular communication mediums. In fact, most professionals prefer email as a business communication medium. When you look in to the details, you will notice that the world wide email usage is...
6 Challenges Financial Marketers Must Overcome to Boost Digital Customer Engagement
Financial marketers are tasked with the job of providing a rich customer experience overall digital channels. They are looking to implement new digital technologies into their business models that could help them engage customers on a much deeper level. The richer the experience, the better is the customer engagement and subsequently, conversions.
A Vape Travelers Guide to International Vaping Laws
Travelers need to be aware that regulations for vaping vary significantly from country to country and if vacationing overseas you need to know the rules of the countries you plan to visit before you leave. Learn all about international vaping laws in this infographic.
60 Unique Ways to Lace Your Shoes
When jogging or running, there are multiple variables that determine the fit and comfort of the shoes you are wearing. Regardless of whether your shoes feel incredible amid your first attempt, there could be times that the upper development will annoy on your foot. Each pair of feet is novel, which is the reason utilizing the correct lacing technique is matter in your running execution.
Partners


Browse Archives By Category
Animated Infographics
Business Infographics
Career & Jobs Infographics
Education Infographics
Entertainment Industry Infographics
Environmental Infographics
Finance & Money Infographics
Food & Drink Infographics
Health Infographics
Historical Infographics
Home & Garden Infographics
Internet Infographics
Law and Legal Infographics
Lifestyle Infographics
Marketing Infographics
Offbeat Infographics
Parenting Infographics
Pets & Animals Infographics
Political Infographics
Shopping Infographics
Sports and Athletic Infographics
Technology Infographics
Transportation Infographics
Travel Infographics
Video Infographics