


Search 12,100+ Infographics!
The Journey of Oprah Winfrey
Oprah Winfrey, the woman from a poverty-stricken family, made her name into history with her most significant achievements. Today, she is the only black woman on the Forbes list of the 400 wealthiest people in America. In the following infographic, Blue Mail Media takes us on the journey of Oprah Winfrey.
The Wealth of U.S. Presidents
How much are past and current U.S Presidents actually worth in today’s dollars? While only one has reached billionaire status, many of them ended up being millionaires. This infographic ranks each of the presidents by their net worth in 2016 U.S. dollars, as well as the annual presidential salary during their time in office.

13 Reasons Why You Should Sleep Naked (According to Science)
There are quite a few health benefits to sleeping naked. Not only can it help you with physical things like thermoregulation, but it can also boost your mood, improve your confidence and increase feelings of trust and intimacy between you and your bed partner. In the following infographic, look at 13 reasons why you should sleep naked.

A Guide to Social Media Customer Care
Social media is becoming the go-to portal when customers want to reach out. I know that is true for myself. One customer may post a query on your Facebook page, while another tweets you with a complaint. Either way, your reputation is at stake when consumer interaction becomes so public. How can you ensure customer satisfaction without compromising your brand?
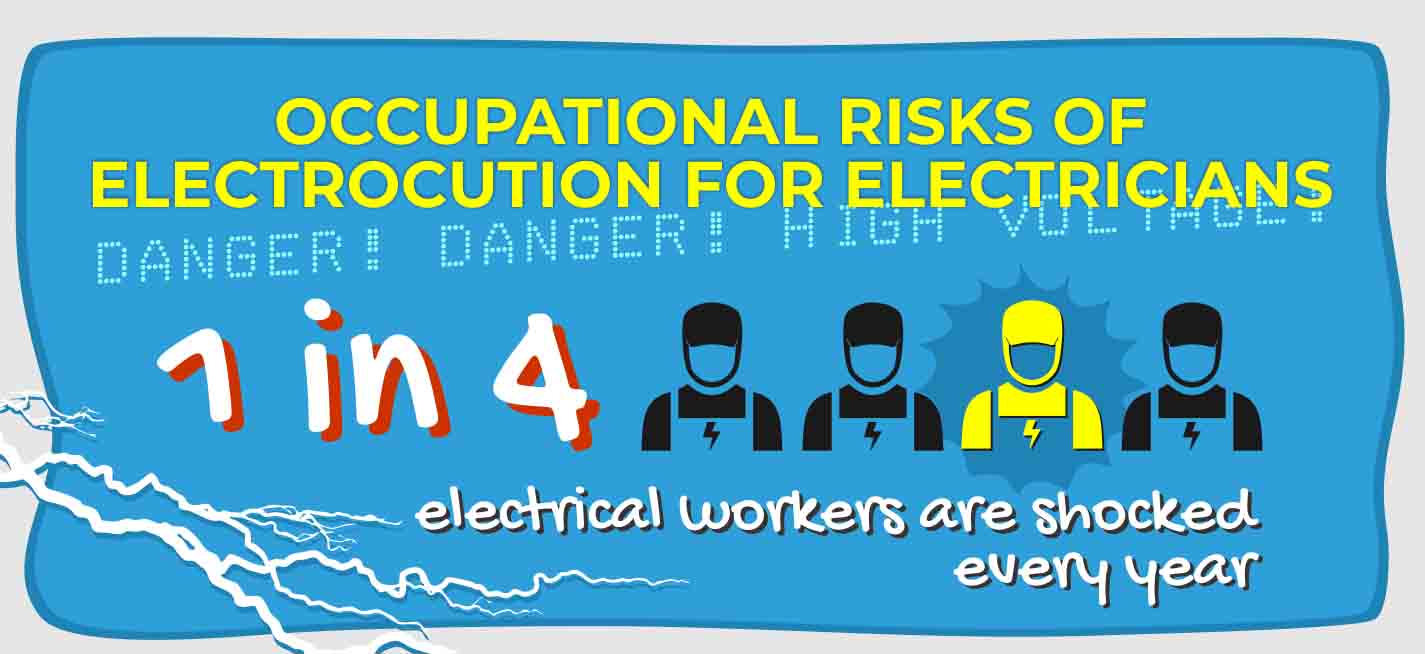
The Top Occupational Risk for Electricians
In this infographic, SmartCSMSmartCSM identifies the most common occurrences for electrocution, how neglected and out-of-date equipment and safety standards play equal factors in these occupational injuries, and why a digital building plan is possibly your simplest fix to reducing the risk of electrocution for electricians.
10 Animals Your Children May Never See
This infographic, courtesy of African Safari Home, highlights the top 10 most critically endangered animals on the planet. The majority of the threat comes from humans and the illegal trafficking / poaching of animals.
41 Gym Member Statistics That Will Surprise You
Have you ever wondered how people actually use their gym memberships? A surge of new members have occurred in health clubs and gyms across the U.S., but that doesn’t necessarily mean everyone is healthier. This infographic reveals 41 surprising statistics and trends about gym memberships and how people use them.
Can AI Replace Your Manager?
Payroll managers face a 96% chance of automation in the near future ー And they’re not the only ones at risk. AI can do a lot of things, including helping out around the office. But at this point in time, can AI replace your manager? Check out this infographic from MBA Central to find out.
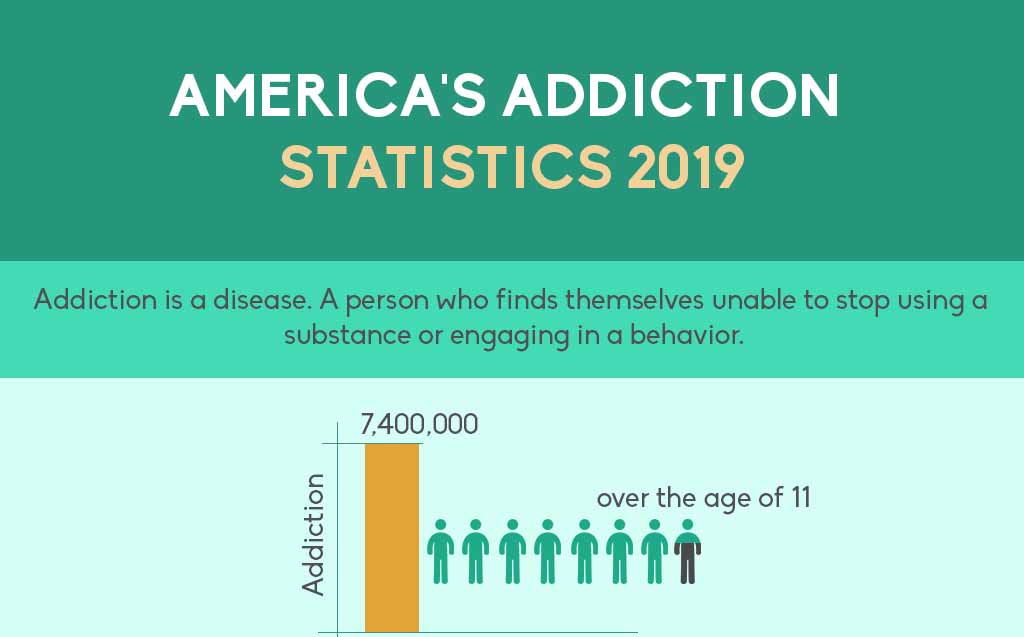
America’s Addiction Statistics 2019
In the following infographic, discover addiction statistics and data for individuals in the United States. For example, there were approximately 7,400,000 people in the United States over the age of 11 with addiction in 2016. Read on for additional statistics.
A Small Business Guide to YouTube Marketing
By the year 2021, a million minutes of video will cross the Internet every second of the day! If that was astounding enough, many experts are predicting that by the end of 2019, video content will account for 80% of all internet traffic. With 1.3 billion annual YouTube users, small businesses everywhere need to get serious about video marketing.
The Journey of Oprah Winfrey
Oprah Winfrey, the woman from a poverty-stricken family, made her name into history with her most significant achievements. Today, she is the only black woman on the Forbes list of the 400 wealthiest people in America. In the following infographic, Blue Mail Media takes us on the journey of Oprah Winfrey.
The Wealth of U.S. Presidents
How much are past and current U.S Presidents actually worth in today’s dollars? While only one has reached billionaire status, many of them ended up being millionaires. This infographic ranks each of the presidents by their net worth in 2016 U.S. dollars, as well as the annual presidential salary during their time in office.
13 Reasons Why You Should Sleep Naked (According to Science)
There are quite a few health benefits to sleeping naked. Not only can it help you with physical things like thermoregulation, but it can also boost your mood, improve your confidence and increase feelings of trust and intimacy between you and your bed partner. In the following infographic, look at 13 reasons why you should sleep naked.
A Guide to Social Media Customer Care
Social media is becoming the go-to portal when customers want to reach out. I know that is true for myself. One customer may post a query on your Facebook page, while another tweets you with a complaint. Either way, your reputation is at stake when consumer interaction becomes so public. How can you ensure customer satisfaction without compromising your brand?
The Top Occupational Risk for Electricians
In this infographic, SmartCSMSmartCSM identifies the most common occurrences for electrocution, how neglected and out-of-date equipment and safety standards play equal factors in these occupational injuries, and why a digital building plan is possibly your simplest fix to reducing the risk of electrocution for electricians.
10 Animals Your Children May Never See
This infographic, courtesy of African Safari Home, highlights the top 10 most critically endangered animals on the planet. The majority of the threat comes from humans and the illegal trafficking / poaching of animals.
41 Gym Member Statistics That Will Surprise You
Have you ever wondered how people actually use their gym memberships? A surge of new members have occurred in health clubs and gyms across the U.S., but that doesn’t necessarily mean everyone is healthier. This infographic reveals 41 surprising statistics and trends about gym memberships and how people use them.
Can AI Replace Your Manager?
Payroll managers face a 96% chance of automation in the near future ー And they’re not the only ones at risk. AI can do a lot of things, including helping out around the office. But at this point in time, can AI replace your manager? Check out this infographic from MBA Central to find out.
America’s Addiction Statistics 2019
In the following infographic, discover addiction statistics and data for individuals in the United States. For example, there were approximately 7,400,000 people in the United States over the age of 11 with addiction in 2016. Read on for additional statistics.
A Small Business Guide to YouTube Marketing
By the year 2021, a million minutes of video will cross the Internet every second of the day! If that was astounding enough, many experts are predicting that by the end of 2019, video content will account for 80% of all internet traffic. With 1.3 billion annual YouTube users, small businesses everywhere need to get serious about video marketing.
Partners


Browse Archives By Category
Animated Infographics
Business Infographics
Career & Jobs Infographics
Education Infographics
Entertainment Industry Infographics
Environmental Infographics
Finance & Money Infographics
Food & Drink Infographics
Health Infographics
Historical Infographics
Home & Garden Infographics
Internet Infographics
Law and Legal Infographics
Lifestyle Infographics
Marketing Infographics
Offbeat Infographics
Parenting Infographics
Pets & Animals Infographics
Political Infographics
Shopping Infographics
Sports and Athletic Infographics
Technology Infographics
Transportation Infographics
Travel Infographics
Video Infographics