


Search 12,100+ Infographics!

Video Export Guide To Social Media
Exporting video with any software including more advanced and professional video editors such as Adobe Premiere Pro requires a lot of details to remember. This is especially true when exporting video for online platforms and social media. This infographic will show you the optimal settings so you know how to export in premiere pro or any other video editing software.
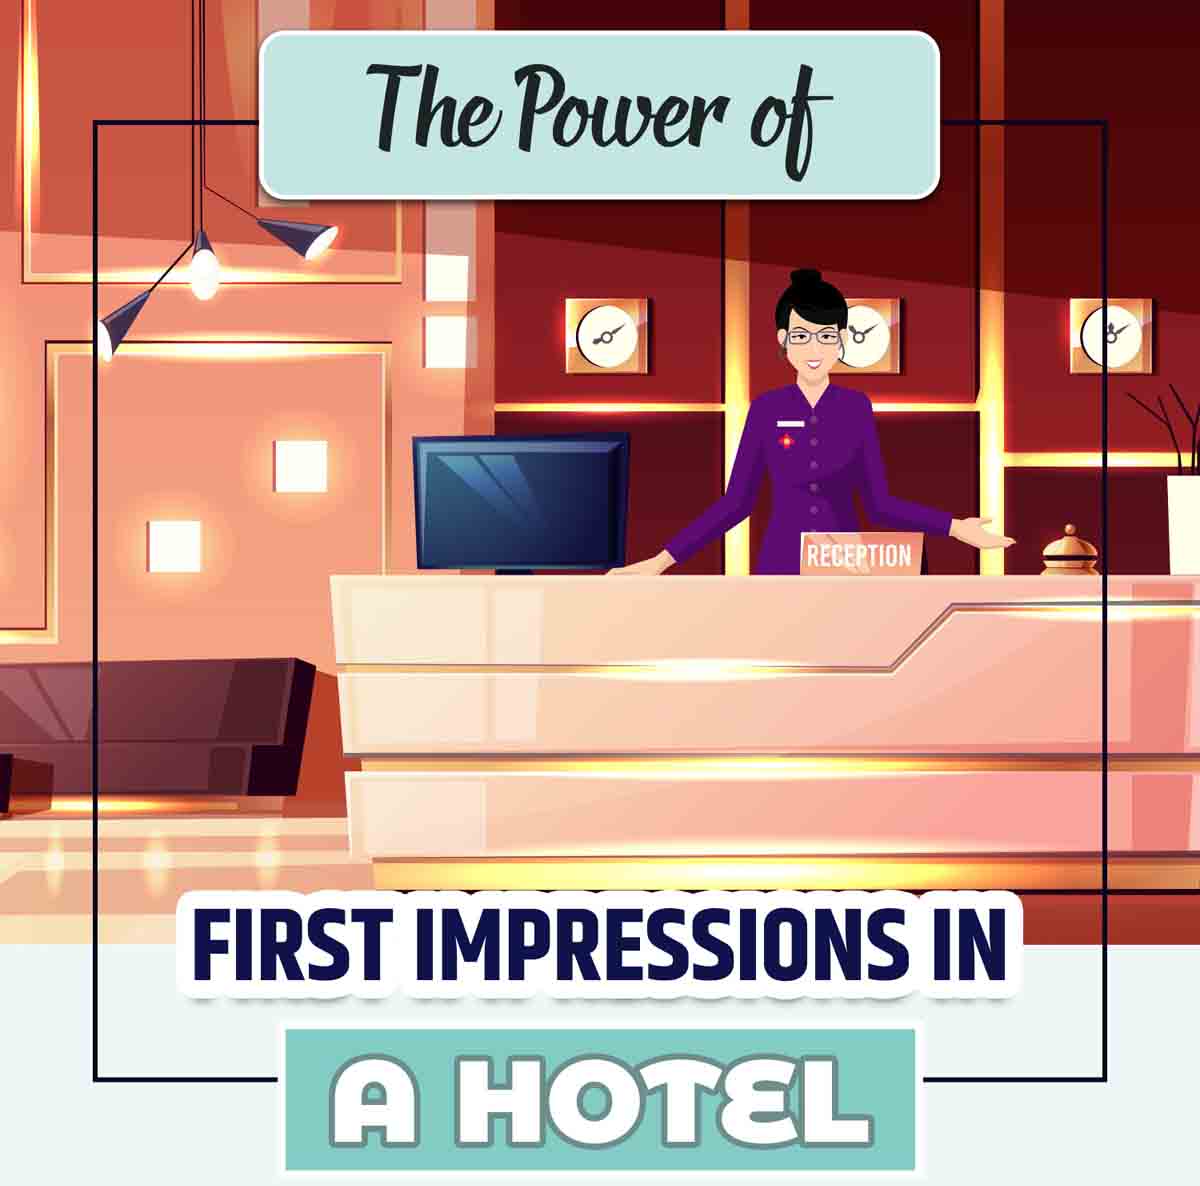
The Power of First Impressions in a Hotel
First impressions matter. This is even more in the hospitality industry. Hotels need to try to give the best first impression possible so that their guests will not only come back but recommend others to come as well. Areas to look at improving your hotel’s appeal include its online presence, exterior, staff, lobby, gym, and the quality of guest rooms.
The Hateful Seven – The Most Energy Hungry Devices in Your Home
The team at Generator Advisor presents “The Hateful Seven” – the most energy consuming devices in your home. If you don’t get a grip on them, they will quickly add up to your monthly financial damage. Learn which ones are these and what you can do about to minimize their power consumption in this infographic.

The Dangers of Cold Stress
This infographic from the folks at EmTrainingSolutions.com features key facts and figures about the dangers of developing cold stress, with a focus on outdoor workers and how they can protect themselves in extreme cold conditions.

Ecommerce Marketing Strategy Guide
A powerful, results-driven ecommerce marketing strategy will build brand affinity and maximize conversions through the use of valuable content, well-optimized PPC campaigns, SEO, and captivating email marketing campaigns. Take a look at this infographic to learn how you can start working on an effective ecommerce marketing strategy that will maximize ROI.
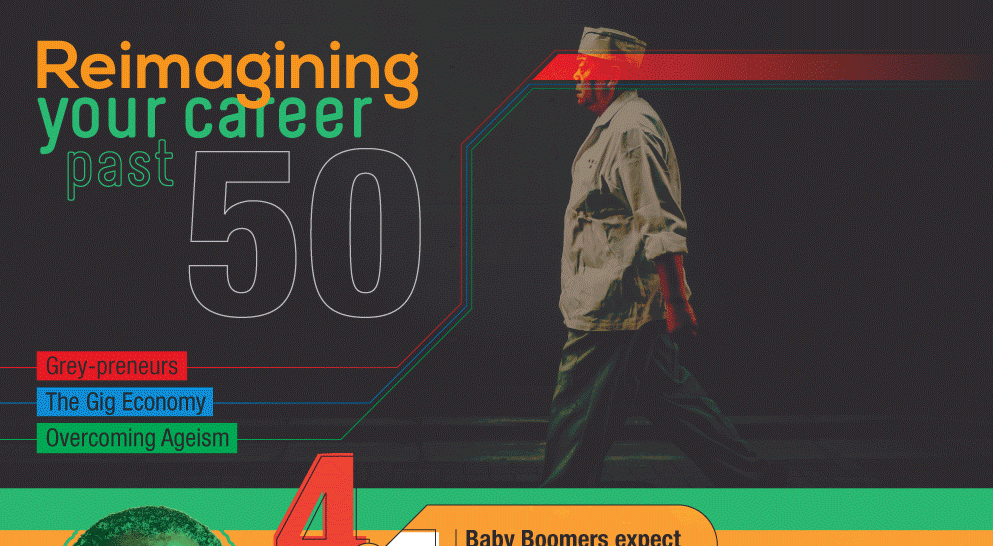
Reimagining Your Career Past 50
4 in 5 Baby Boomers expect to keep working rather than retire due to financial necessity. Greypreneurs and the gig economy may be the answer to overcoming ageism in the workplace. Learn more about the rise of the greypreneur from this infographic from Best Masters Programs.
The Journey of Oprah Winfrey
Oprah Winfrey, the woman from a poverty-stricken family, made her name into history with her most significant achievements. Today, she is the only black woman on the Forbes list of the 400 wealthiest people in America. In the following infographic, Blue Mail Media takes us on the journey of Oprah Winfrey.
The Wealth of U.S. Presidents
How much are past and current U.S Presidents actually worth in today’s dollars? While only one has reached billionaire status, many of them ended up being millionaires. This infographic ranks each of the presidents by their net worth in 2016 U.S. dollars, as well as the annual presidential salary during their time in office.

13 Reasons Why You Should Sleep Naked (According to Science)
There are quite a few health benefits to sleeping naked. Not only can it help you with physical things like thermoregulation, but it can also boost your mood, improve your confidence and increase feelings of trust and intimacy between you and your bed partner. In the following infographic, look at 13 reasons why you should sleep naked.

A Guide to Social Media Customer Care
Social media is becoming the go-to portal when customers want to reach out. I know that is true for myself. One customer may post a query on your Facebook page, while another tweets you with a complaint. Either way, your reputation is at stake when consumer interaction becomes so public. How can you ensure customer satisfaction without compromising your brand?
Video Export Guide To Social Media
Exporting video with any software including more advanced and professional video editors such as Adobe Premiere Pro requires a lot of details to remember. This is especially true when exporting video for online platforms and social media. This infographic will show you the optimal settings so you know how to export in premiere pro or any other video editing software.
The Power of First Impressions in a Hotel
First impressions matter. This is even more in the hospitality industry. Hotels need to try to give the best first impression possible so that their guests will not only come back but recommend others to come as well. Areas to look at improving your hotel’s appeal include its online presence, exterior, staff, lobby, gym, and the quality of guest rooms.
The Hateful Seven – The Most Energy Hungry Devices in Your Home
The team at Generator Advisor presents “The Hateful Seven” – the most energy consuming devices in your home. If you don’t get a grip on them, they will quickly add up to your monthly financial damage. Learn which ones are these and what you can do about to minimize their power consumption in this infographic.
The Dangers of Cold Stress
This infographic from the folks at EmTrainingSolutions.com features key facts and figures about the dangers of developing cold stress, with a focus on outdoor workers and how they can protect themselves in extreme cold conditions.
Ecommerce Marketing Strategy Guide
A powerful, results-driven ecommerce marketing strategy will build brand affinity and maximize conversions through the use of valuable content, well-optimized PPC campaigns, SEO, and captivating email marketing campaigns. Take a look at this infographic to learn how you can start working on an effective ecommerce marketing strategy that will maximize ROI.
Reimagining Your Career Past 50
4 in 5 Baby Boomers expect to keep working rather than retire due to financial necessity. Greypreneurs and the gig economy may be the answer to overcoming ageism in the workplace. Learn more about the rise of the greypreneur from this infographic from Best Masters Programs.
The Journey of Oprah Winfrey
Oprah Winfrey, the woman from a poverty-stricken family, made her name into history with her most significant achievements. Today, she is the only black woman on the Forbes list of the 400 wealthiest people in America. In the following infographic, Blue Mail Media takes us on the journey of Oprah Winfrey.
The Wealth of U.S. Presidents
How much are past and current U.S Presidents actually worth in today’s dollars? While only one has reached billionaire status, many of them ended up being millionaires. This infographic ranks each of the presidents by their net worth in 2016 U.S. dollars, as well as the annual presidential salary during their time in office.
13 Reasons Why You Should Sleep Naked (According to Science)
There are quite a few health benefits to sleeping naked. Not only can it help you with physical things like thermoregulation, but it can also boost your mood, improve your confidence and increase feelings of trust and intimacy between you and your bed partner. In the following infographic, look at 13 reasons why you should sleep naked.
A Guide to Social Media Customer Care
Social media is becoming the go-to portal when customers want to reach out. I know that is true for myself. One customer may post a query on your Facebook page, while another tweets you with a complaint. Either way, your reputation is at stake when consumer interaction becomes so public. How can you ensure customer satisfaction without compromising your brand?
Partners


Browse Archives By Category
Animated Infographics
Business Infographics
Career & Jobs Infographics
Education Infographics
Entertainment Industry Infographics
Environmental Infographics
Finance & Money Infographics
Food & Drink Infographics
Health Infographics
Historical Infographics
Home & Garden Infographics
Internet Infographics
Law and Legal Infographics
Lifestyle Infographics
Marketing Infographics
Offbeat Infographics
Parenting Infographics
Pets & Animals Infographics
Political Infographics
Shopping Infographics
Sports and Athletic Infographics
Technology Infographics
Transportation Infographics
Travel Infographics
Video Infographics