


Search 12,000+ Infographics!

The Safest (and Most Dangerous) National Parks in the U.S.
The National Parks are an American treasure conserving the country’s wilderness while inviting visitors from worldwide to come explore. Naturally, these trips can come with some risks depending on the visitors’ activities and which park they’ve chosen to visit. Here’s an infographic ranking the safest and most dangerous parks in the nation.
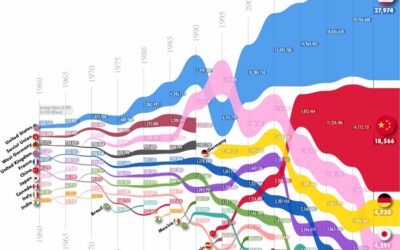
The 10 Biggest Economies in the World Over Time
Studying economies over time can tell us a lot about different decades and what commerce countries relied on to rise and fall with the changes. The team at Madison Trust Company have put together this illuminating graphic that shows the top 10 GDPs from 1960 to 2024.

Which Outdoor Activities Do People Spend The Most On?
What did people spend the most money on? Maybe it’s no surprise that the catch all category of Multi-Use Apparel and Accessories was the winner. This could include clothing, backpacks, coolers, bugs spray, water bottles, sunscreen etc.
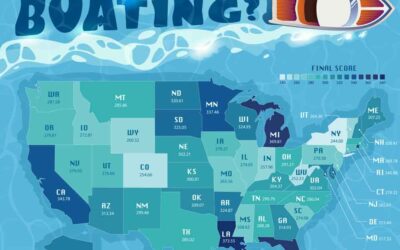
What Is The Best State In the U.S. For Boating?
The team at SIYachts.com have created the following infographic for boaters and travelers which ranks every U.S. State by how boater-friendly it is. They used a long list of criteria to determine this ranking, including data on weather, coastline, number of marinas, number of licensed boats in the state, etc. The results offer a nice variety, representing states in regions all over the country.

The Statistics on Student Attention Spans
The app, Brainscape, provides study tools for serious students, and their team noticed a fascinating statistic: students who use their app to study are putting in more and more hours, implying that their attention spans are improving. The team at Brainscape delved deeper into the data to get a true picture of the statistics and to find out why students who use their app are bucking the trends.
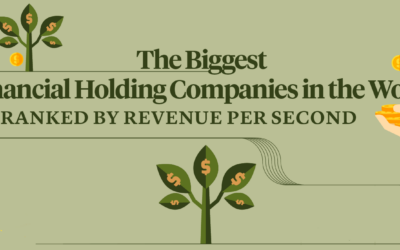
The Biggest Financial Holding Companies in the World
Financial holding companies are banks that might own other financial service companies and act as parent companies to subsidiaries. As you can imagine, companies that deal with money make a lot of it! This graphic is a fascinating look at the very top banks and financial companies in the U.S. ranked by how much money they made per second in 2023.

The Journey of Water: From Source to Tap in a Sustainable World
Global water use has surged six-fold in the past century, and by 2025, two-thirds of the world’s population may face water scarcity. Advancements in water storage technology, including IoT-based systems, have significantly reduced wastage. Here is an infographic that explores the critical journey of industrial water storage and the need for sustainable management.

11 Best Practices for Sales Onboarding
When it comes to sales performance, getting the most out of your team starts with strong onboarding. Organizations with effective onboarding are 6.3x more likely to prepare their new sales hires to succeed. Like any other sales training or enablement initiative, onboarding takes foresight and planning to do well. In this infographic, discover 11 best practices for creating an onboarding program that prepares new hires to sell effectively.

The History Of The England Football Kit
Because the England football team have recently got a brand new and controversial kit due to the colors being changed on the Saint George’s Cross and because Euro 2024 is happening soon, the team at UK Feather Flags have put together the following infographic which takes a look at how their kit has evolved over the years.

The Rising Cost of the Average US Home
It’s all over the news and on display in this graphic from Madison Trust Company: home prices are rising dramatically. This graph shows the average American home price every year since the 60s. The information includes the average cost alongside the price adjusted for inflation.
The Safest (and Most Dangerous) National Parks in the U.S.
The National Parks are an American treasure conserving the country’s wilderness while inviting visitors from worldwide to come explore. Naturally, these trips can come with some risks depending on the visitors’ activities and which park they’ve chosen to visit. Here’s an infographic ranking the safest and most dangerous parks in the nation.
The 10 Biggest Economies in the World Over Time
Studying economies over time can tell us a lot about different decades and what commerce countries relied on to rise and fall with the changes. The team at Madison Trust Company have put together this illuminating graphic that shows the top 10 GDPs from 1960 to 2024.
Which Outdoor Activities Do People Spend The Most On?
What did people spend the most money on? Maybe it’s no surprise that the catch all category of Multi-Use Apparel and Accessories was the winner. This could include clothing, backpacks, coolers, bugs spray, water bottles, sunscreen etc.
What Is The Best State In the U.S. For Boating?
The team at SIYachts.com have created the following infographic for boaters and travelers which ranks every U.S. State by how boater-friendly it is. They used a long list of criteria to determine this ranking, including data on weather, coastline, number of marinas, number of licensed boats in the state, etc. The results offer a nice variety, representing states in regions all over the country.
The Statistics on Student Attention Spans
The app, Brainscape, provides study tools for serious students, and their team noticed a fascinating statistic: students who use their app to study are putting in more and more hours, implying that their attention spans are improving. The team at Brainscape delved deeper into the data to get a true picture of the statistics and to find out why students who use their app are bucking the trends.
The Biggest Financial Holding Companies in the World
Financial holding companies are banks that might own other financial service companies and act as parent companies to subsidiaries. As you can imagine, companies that deal with money make a lot of it! This graphic is a fascinating look at the very top banks and financial companies in the U.S. ranked by how much money they made per second in 2023.
The Journey of Water: From Source to Tap in a Sustainable World
Global water use has surged six-fold in the past century, and by 2025, two-thirds of the world’s population may face water scarcity. Advancements in water storage technology, including IoT-based systems, have significantly reduced wastage. Here is an infographic that explores the critical journey of industrial water storage and the need for sustainable management.
11 Best Practices for Sales Onboarding
When it comes to sales performance, getting the most out of your team starts with strong onboarding. Organizations with effective onboarding are 6.3x more likely to prepare their new sales hires to succeed. Like any other sales training or enablement initiative, onboarding takes foresight and planning to do well. In this infographic, discover 11 best practices for creating an onboarding program that prepares new hires to sell effectively.
The History Of The England Football Kit
Because the England football team have recently got a brand new and controversial kit due to the colors being changed on the Saint George’s Cross and because Euro 2024 is happening soon, the team at UK Feather Flags have put together the following infographic which takes a look at how their kit has evolved over the years.
The Rising Cost of the Average US Home
It’s all over the news and on display in this graphic from Madison Trust Company: home prices are rising dramatically. This graph shows the average American home price every year since the 60s. The information includes the average cost alongside the price adjusted for inflation.
Partners


Browse Archives By Category
Animated Infographics
Business Infographics
Career & Jobs Infographics
Education Infographics
Entertainment Industry Infographics
Environmental Infographics
Finance & Money Infographics
Food & Drink Infographics
Health Infographics
Historical Infographics
Home & Garden Infographics
Internet Infographics
Law and Legal Infographics
Lifestyle Infographics
Marketing Infographics
Offbeat Infographics
Parenting Infographics
Pets & Animals Infographics
Political Infographics
Shopping Infographics
Sports and Athletic Infographics
Technology Infographics
Transportation Infographics
Travel Infographics
Video Infographics