


Search 12,100+ Infographics!
Motorcycle Accidents: Facts You Should Know
Though motorcycles make up just 3% of vehicles on the road, motorcyclists account for 14% of fatal accidents. Motorcycle safety is a big deal. The following infographic shows just how dangerous motorcycles can be when drivers aren’t careful. It takes all of us paying attention — cars, trucks, and motorcyclists all together — to make the roads safe.
8 Iconic Road Trips Around the World
Embarking on an iconic road trip could add a few hours to your trip, but it will be well worth it. Surrounding yourself with gorgeous scenery breaks through the clutter in your mind. You may feel powerful emotions, think new thoughts, and even become more in tune with yourself. Awe-inspiring views, historic markers, and even good eats pave the way to wherever you’re going — you just have to know how to find them.
Benefits of Using a Virtual Private Network
VPNs are normally used by businesses or organizations rather than by individuals, but virtual networks can be reached from inside a home network as well. Compared to other technologies, VPNs offers several advantages, particularly benefits for wireless local area networking. For anyone looking to provide a secure network for its client base, a VPN offers the most benefits to users.

History’s Wealthiest & How Much They Would Be Worth Today
The team at TitleMax.com calculated what the world’s richest people of past would’ve made in today’s dollars. In some cases, it is trillions! Using expert estimates and adjusting for inflation, these are the top earners in the world who have ever lived. You’ve got a long way to go, Jeff Bezos.
Obesity & Heart Health: Risk Factors & Prevention
Obesity refers to a generalized accumulation of excess adipose tissues in the body which leads to more than 20% of the desirable body weight. While obesity can lead to many diseases, one of the greatest concerns is your heart. People with obesity tend to have many risk factors. How exactly do you know if you are obese and what can you do to get back on the path to fitness?
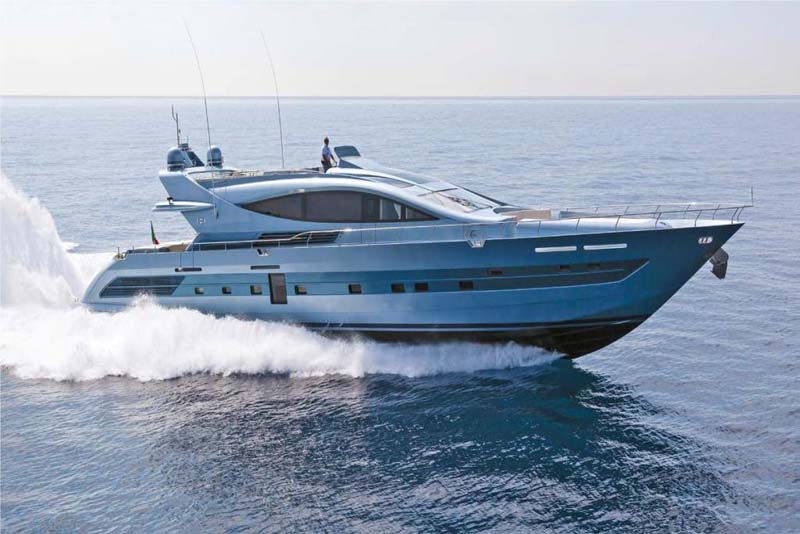
Top 10 Applications for Plastic on Boats
Thinking about buying a new boat, or just admiring your neighbors? Have you ever stopped to think about what materials go into the construction of a new boat, and why they’re used? Piedmont Plastics has put together a useful infographic to help us think about how durable, lightweight plastics are used to create today’s sea-faring vessels.

Winter Safety Tips: Survival Kit
With Winter’s becoming harsher all the time, staying safe on the roads is more important than ever. Jardine Motors Group has put together a checklist of useful items to carry in the winter, especially should you encounter any snow or ice.

Do You Need Planning Permission For Your Garden?
Most garden buildings come under permitted development rights, which means you don’t need planning permission. This is good news if you’re planning to add a shed, summer house, log cabin or home office to your garden. But how do you know if you need planning permission? Check out the following infographic for more details.
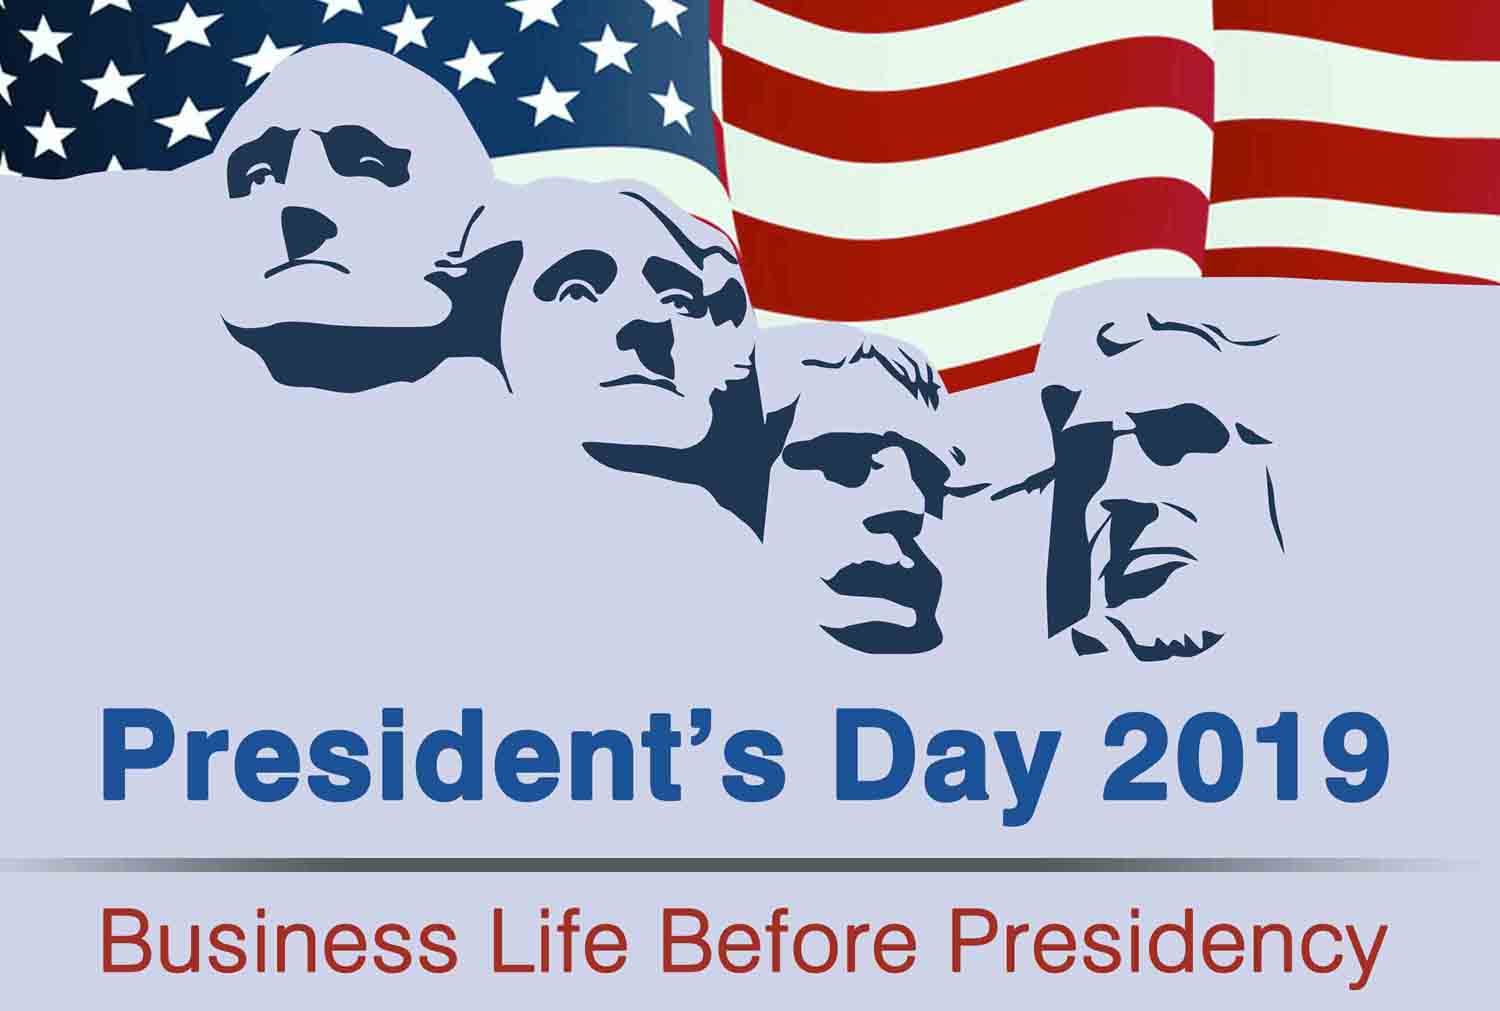
Business Life Before U.S. Presidency
We have seen 45 U.S. Presidents to date, some of which were managing their own businesses before taking office as the President of the United States. Hence it’s not a surprise how these Presidents have had some interesting things to say and show about marketing throughout American history. This infographic takes a look at the business life of some U.S. Presidents.
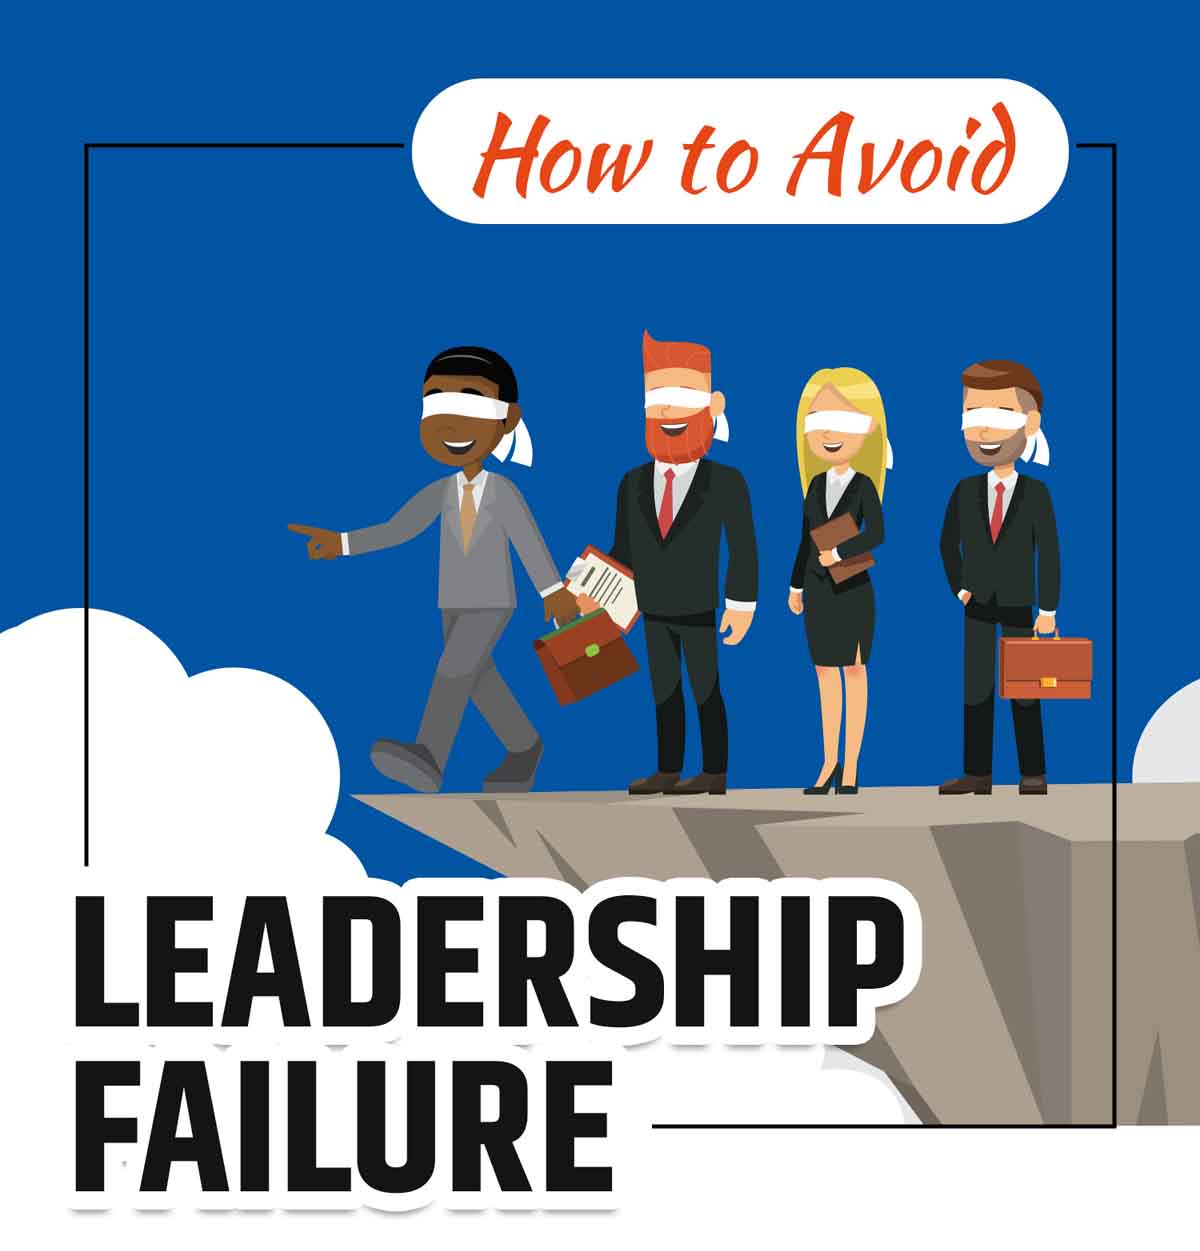
How to Avoid Leadership Failure
Serving in a management role has many challenges including failing to thrive as a leader. Over 90% of active management would like to receive additional training, and almost 80% of employees change jobs because they do not feel appreciated. Common leadership failures include issues with delegation, miscommunication, vanity, micromanagement, confrontation, and goals.
Motorcycle Accidents: Facts You Should Know
Though motorcycles make up just 3% of vehicles on the road, motorcyclists account for 14% of fatal accidents. Motorcycle safety is a big deal. The following infographic shows just how dangerous motorcycles can be when drivers aren’t careful. It takes all of us paying attention — cars, trucks, and motorcyclists all together — to make the roads safe.
8 Iconic Road Trips Around the World
Embarking on an iconic road trip could add a few hours to your trip, but it will be well worth it. Surrounding yourself with gorgeous scenery breaks through the clutter in your mind. You may feel powerful emotions, think new thoughts, and even become more in tune with yourself. Awe-inspiring views, historic markers, and even good eats pave the way to wherever you’re going — you just have to know how to find them.
Benefits of Using a Virtual Private Network
VPNs are normally used by businesses or organizations rather than by individuals, but virtual networks can be reached from inside a home network as well. Compared to other technologies, VPNs offers several advantages, particularly benefits for wireless local area networking. For anyone looking to provide a secure network for its client base, a VPN offers the most benefits to users.
History’s Wealthiest & How Much They Would Be Worth Today
The team at TitleMax.com calculated what the world’s richest people of past would’ve made in today’s dollars. In some cases, it is trillions! Using expert estimates and adjusting for inflation, these are the top earners in the world who have ever lived. You’ve got a long way to go, Jeff Bezos.
Obesity & Heart Health: Risk Factors & Prevention
Obesity refers to a generalized accumulation of excess adipose tissues in the body which leads to more than 20% of the desirable body weight. While obesity can lead to many diseases, one of the greatest concerns is your heart. People with obesity tend to have many risk factors. How exactly do you know if you are obese and what can you do to get back on the path to fitness?
Top 10 Applications for Plastic on Boats
Thinking about buying a new boat, or just admiring your neighbors? Have you ever stopped to think about what materials go into the construction of a new boat, and why they’re used? Piedmont Plastics has put together a useful infographic to help us think about how durable, lightweight plastics are used to create today’s sea-faring vessels.
Winter Safety Tips: Survival Kit
With Winter’s becoming harsher all the time, staying safe on the roads is more important than ever. Jardine Motors Group has put together a checklist of useful items to carry in the winter, especially should you encounter any snow or ice.
Do You Need Planning Permission For Your Garden?
Most garden buildings come under permitted development rights, which means you don’t need planning permission. This is good news if you’re planning to add a shed, summer house, log cabin or home office to your garden. But how do you know if you need planning permission? Check out the following infographic for more details.
Business Life Before U.S. Presidency
We have seen 45 U.S. Presidents to date, some of which were managing their own businesses before taking office as the President of the United States. Hence it’s not a surprise how these Presidents have had some interesting things to say and show about marketing throughout American history. This infographic takes a look at the business life of some U.S. Presidents.
How to Avoid Leadership Failure
Serving in a management role has many challenges including failing to thrive as a leader. Over 90% of active management would like to receive additional training, and almost 80% of employees change jobs because they do not feel appreciated. Common leadership failures include issues with delegation, miscommunication, vanity, micromanagement, confrontation, and goals.
Partners


Browse Archives By Category
Animated Infographics
Business Infographics
Career & Jobs Infographics
Education Infographics
Entertainment Industry Infographics
Environmental Infographics
Finance & Money Infographics
Food & Drink Infographics
Health Infographics
Historical Infographics
Home & Garden Infographics
Internet Infographics
Law and Legal Infographics
Lifestyle Infographics
Marketing Infographics
Offbeat Infographics
Parenting Infographics
Pets & Animals Infographics
Political Infographics
Shopping Infographics
Sports and Athletic Infographics
Technology Infographics
Transportation Infographics
Travel Infographics
Video Infographics