


Search 12,100+ Infographics!
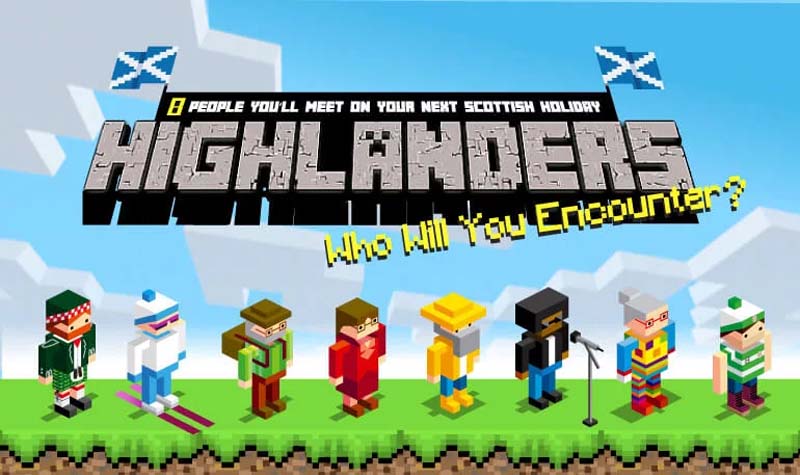
8 People You’ll Meet on Your Scottish Holiday
To celebrate Burns Night at the end of January, holidaycottages have created a fun infographic to introduce you to the 8 different people you might meet during your Scottish travels. Famous for their inventions, engineering prowess and history and heritage that dates back millennia, Scottish people are without a doubt some of the warmest and friendliest people you could ever hope to meet.

The Future of Technical Support Outsourcing
If you evaluate the growth of your business in the last year, you’ll come to notice the role of technology in your day-to-day operations. Without it, you would not have been able to harvest data for analysis, create online services, or nurture leads, to name a few. These are only some of the few reasons why technical support outsourcing should be one of your company’s top priorities.
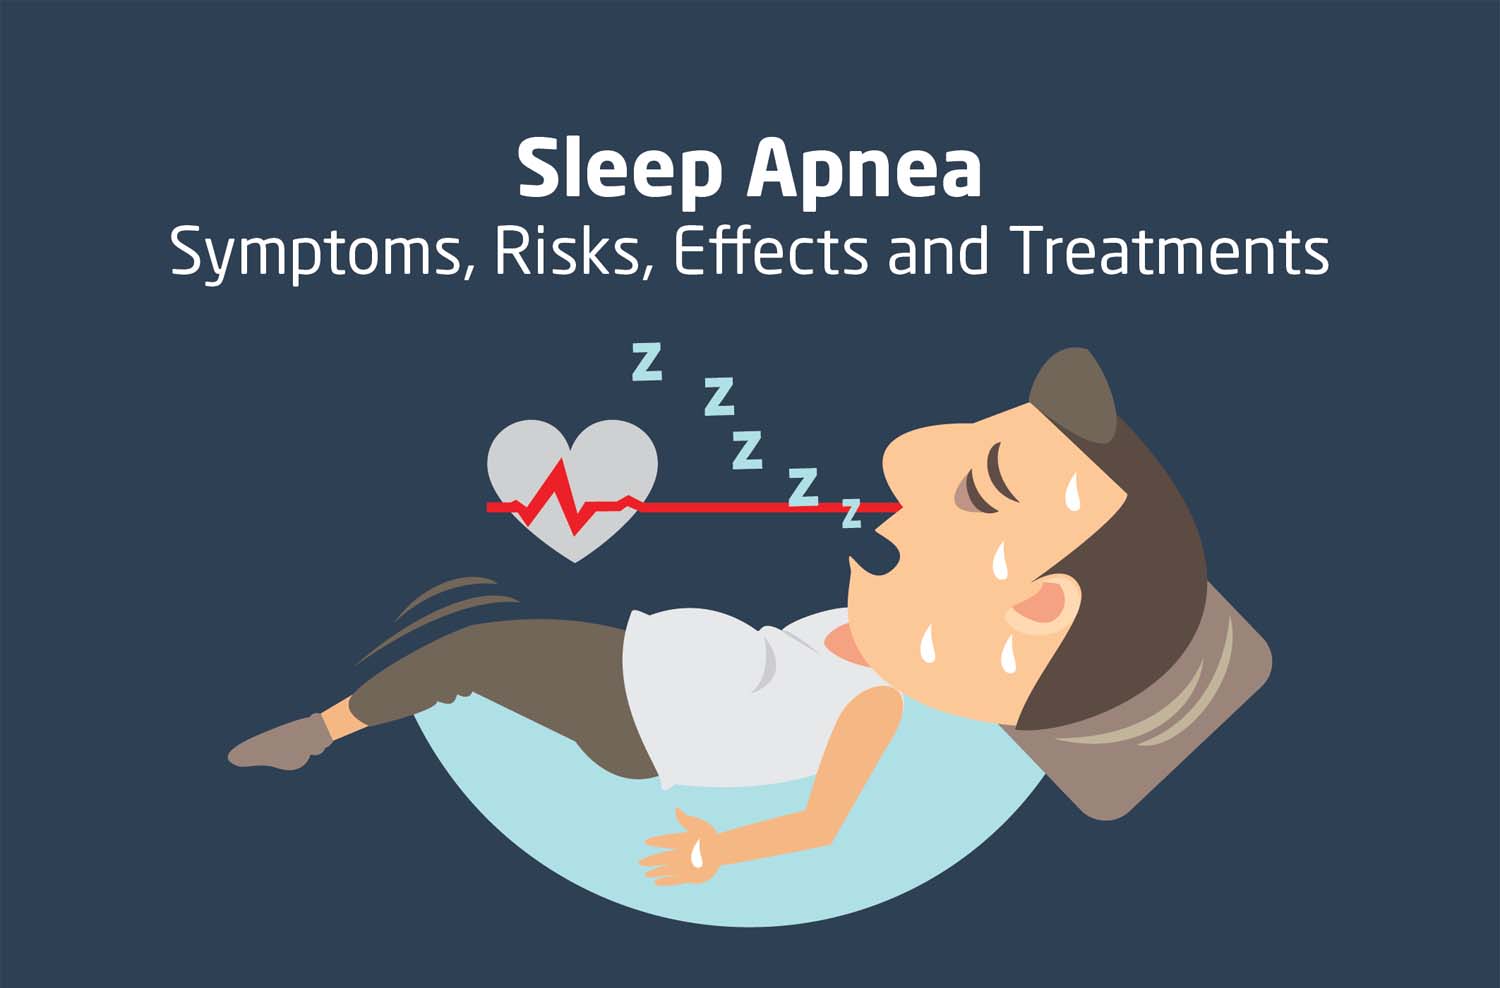
Sleep Apnea: Symptoms, Risks, Effects, and Treatment
Sleep apnea is one of the most common sleep disorders. Some of the causes of sleep apnea include obesity, age, enlarged tonsils, and endocrine disorders, to name a few. It is important you know and can judge for yourself whether you are sleeping truly well or if you have some form of sleep disorder. In the following infographic, learn about sleep apnea.

Encyclopedia of Pasta
I love pasta! I also love how many various ways it can be served. Spaghetti and meatballs, cheesy macaroni, stuffed shells and even a variety of soups are just a few of many ways pasta is enjoyed by people all over the world. And as varied as the ways past can be...

The Most and Least Educated Cities in the United States by Degree Attainment
Which cities in the United States are considered to be the most educated? And which are the least educated? Many would expect to see bigger cities sitting at the top of the list, but that isn’t necessarily the case. Using 2017 census data and taking four different factors into consideration, this infographic breaks down the top 10 most educated and the top 10 least educated cities.
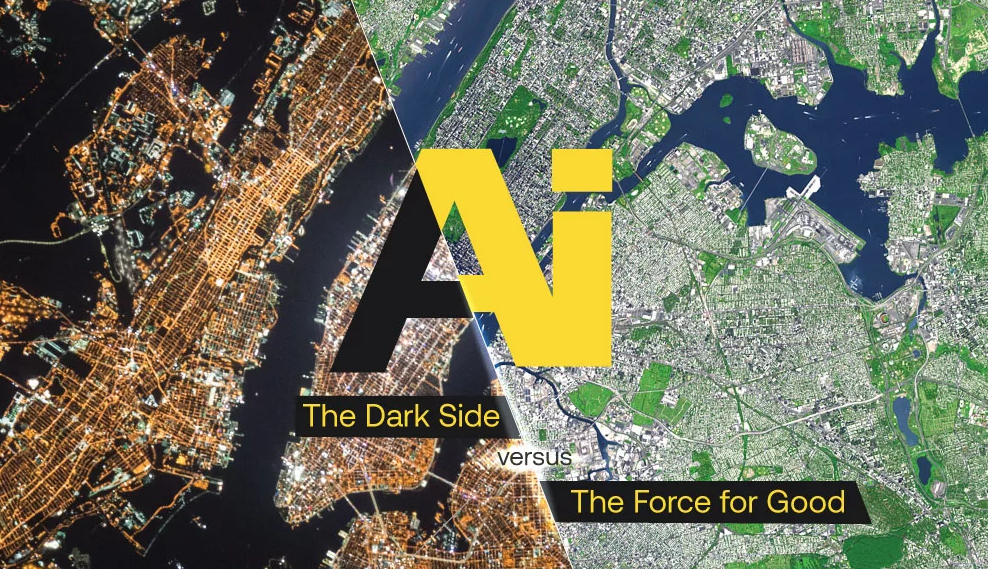
AI: The Dark Side Versus The Force For Good
Artificial intelligence can do amazing things in our world today. It can also do awful things if we let it. The choice is ours as to whether AI will be good or evil. Learn more about the dark side of artificial intelligence versus the force for good in this infographic.

The Future of Global eHealth
Access to affordable, effective health care continues to be a major concern for people around the world. But governments that adopt eHealth policies can find ways to use communication and technology advancements to help ensure more people receive better health care. Here, University of Illinois at Chicago takes a look at government strides in adopting eHealth, the barriers to maximizing eHealth’s full potential, and what some countries have learned along the way.

Blockchain Driving App Security, M-Commerce and Payments
This infographic by AppTech explores the particular ways that blockchain technology will tackle some of the extreme bottlenecks of the mobile app security and m-commerce industries in the next few years.

DIY Guide To Removing Toilet Mold
Mold in the home is in most cases inevitable and should be eradicated whenever found. One of the places it can often be found indoors is in and around the toilet. It’s usually caused by a number of reasons such as excess humidity, long periods of standing water in the tank and bowl and sometimes even because of irregular cleaning.
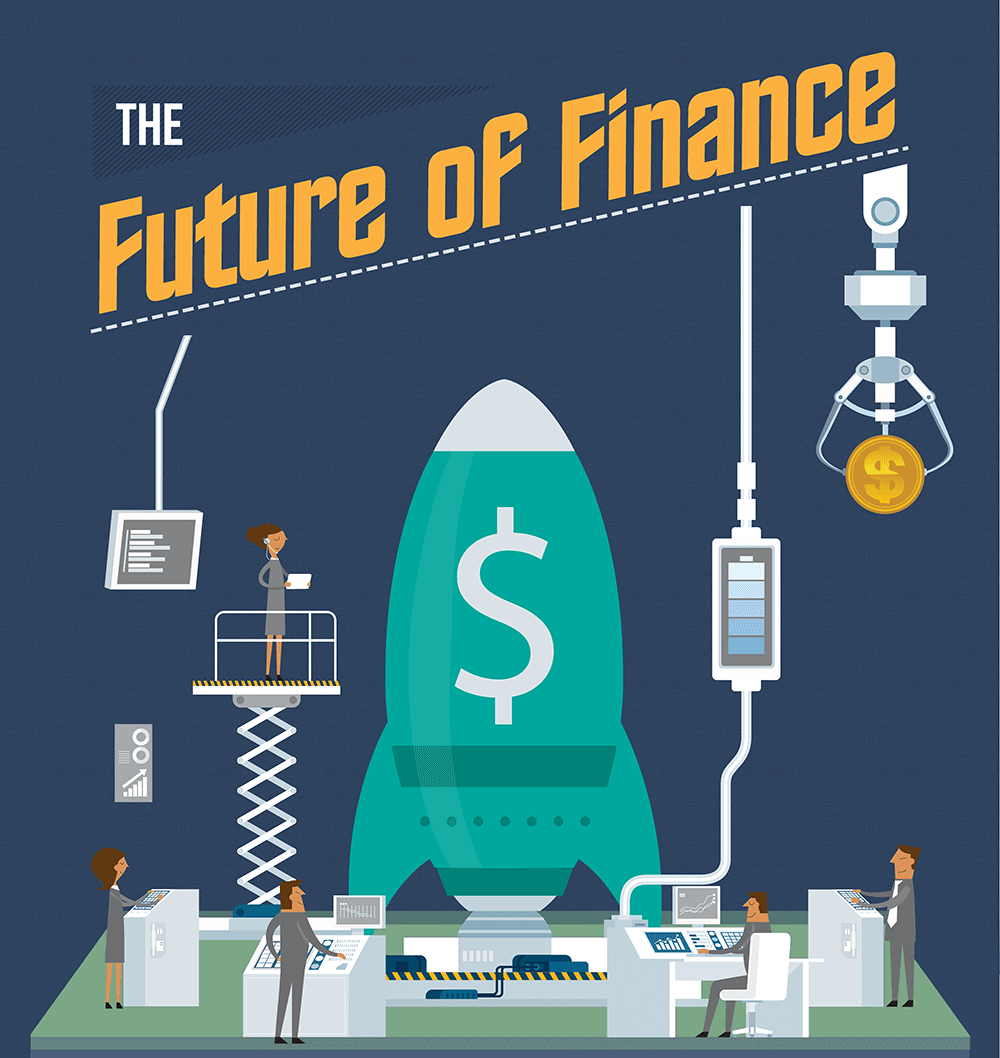
The Future of Finance
Technology has impacted virtually every industry, particularly the financial sector. Whether it’s the development of new forms of currency or expanding how and where investors can trade, the financial industry is evolving at an unprecedented rate. Mobile apps, online lending platforms, and smaller, more agile organizations are successfully competing with large, established firms.
8 People You’ll Meet on Your Scottish Holiday
To celebrate Burns Night at the end of January, holidaycottages have created a fun infographic to introduce you to the 8 different people you might meet during your Scottish travels. Famous for their inventions, engineering prowess and history and heritage that dates back millennia, Scottish people are without a doubt some of the warmest and friendliest people you could ever hope to meet.
The Future of Technical Support Outsourcing
If you evaluate the growth of your business in the last year, you’ll come to notice the role of technology in your day-to-day operations. Without it, you would not have been able to harvest data for analysis, create online services, or nurture leads, to name a few. These are only some of the few reasons why technical support outsourcing should be one of your company’s top priorities.
Sleep Apnea: Symptoms, Risks, Effects, and Treatment
Sleep apnea is one of the most common sleep disorders. Some of the causes of sleep apnea include obesity, age, enlarged tonsils, and endocrine disorders, to name a few. It is important you know and can judge for yourself whether you are sleeping truly well or if you have some form of sleep disorder. In the following infographic, learn about sleep apnea.
Encyclopedia of Pasta
I love pasta! I also love how many various ways it can be served. Spaghetti and meatballs, cheesy macaroni, stuffed shells and even a variety of soups are just a few of many ways pasta is enjoyed by people all over the world. And as varied as the ways past can be...
The Most and Least Educated Cities in the United States by Degree Attainment
Which cities in the United States are considered to be the most educated? And which are the least educated? Many would expect to see bigger cities sitting at the top of the list, but that isn’t necessarily the case. Using 2017 census data and taking four different factors into consideration, this infographic breaks down the top 10 most educated and the top 10 least educated cities.
AI: The Dark Side Versus The Force For Good
Artificial intelligence can do amazing things in our world today. It can also do awful things if we let it. The choice is ours as to whether AI will be good or evil. Learn more about the dark side of artificial intelligence versus the force for good in this infographic.
The Future of Global eHealth
Access to affordable, effective health care continues to be a major concern for people around the world. But governments that adopt eHealth policies can find ways to use communication and technology advancements to help ensure more people receive better health care. Here, University of Illinois at Chicago takes a look at government strides in adopting eHealth, the barriers to maximizing eHealth’s full potential, and what some countries have learned along the way.
Blockchain Driving App Security, M-Commerce and Payments
This infographic by AppTech explores the particular ways that blockchain technology will tackle some of the extreme bottlenecks of the mobile app security and m-commerce industries in the next few years.
DIY Guide To Removing Toilet Mold
Mold in the home is in most cases inevitable and should be eradicated whenever found. One of the places it can often be found indoors is in and around the toilet. It’s usually caused by a number of reasons such as excess humidity, long periods of standing water in the tank and bowl and sometimes even because of irregular cleaning.
The Future of Finance
Technology has impacted virtually every industry, particularly the financial sector. Whether it’s the development of new forms of currency or expanding how and where investors can trade, the financial industry is evolving at an unprecedented rate. Mobile apps, online lending platforms, and smaller, more agile organizations are successfully competing with large, established firms.
Partners


Browse Archives By Category
Animated Infographics
Business Infographics
Career & Jobs Infographics
Education Infographics
Entertainment Industry Infographics
Environmental Infographics
Finance & Money Infographics
Food & Drink Infographics
Health Infographics
Historical Infographics
Home & Garden Infographics
Internet Infographics
Law and Legal Infographics
Lifestyle Infographics
Marketing Infographics
Offbeat Infographics
Parenting Infographics
Pets & Animals Infographics
Political Infographics
Shopping Infographics
Sports and Athletic Infographics
Technology Infographics
Transportation Infographics
Travel Infographics
Video Infographics