


Search 12,100+ Infographics!

Doing It Their Way: Gen Z And Entrepreneurship
Gen Z is shaping up to be one of the most entrepreneurial generations in history, but why? Watching their elders get kicked around by a bad economy is just one of the reasons. Learn more about GenZ and entrepreneurship within this infographic from Online Schools Center.

The Art And Science Of Scalability
When you start a business, chances are future growth is the furthest thing from your mind. That’s why you need to learn more about the art and science of scalability, as outlined in this infographic.
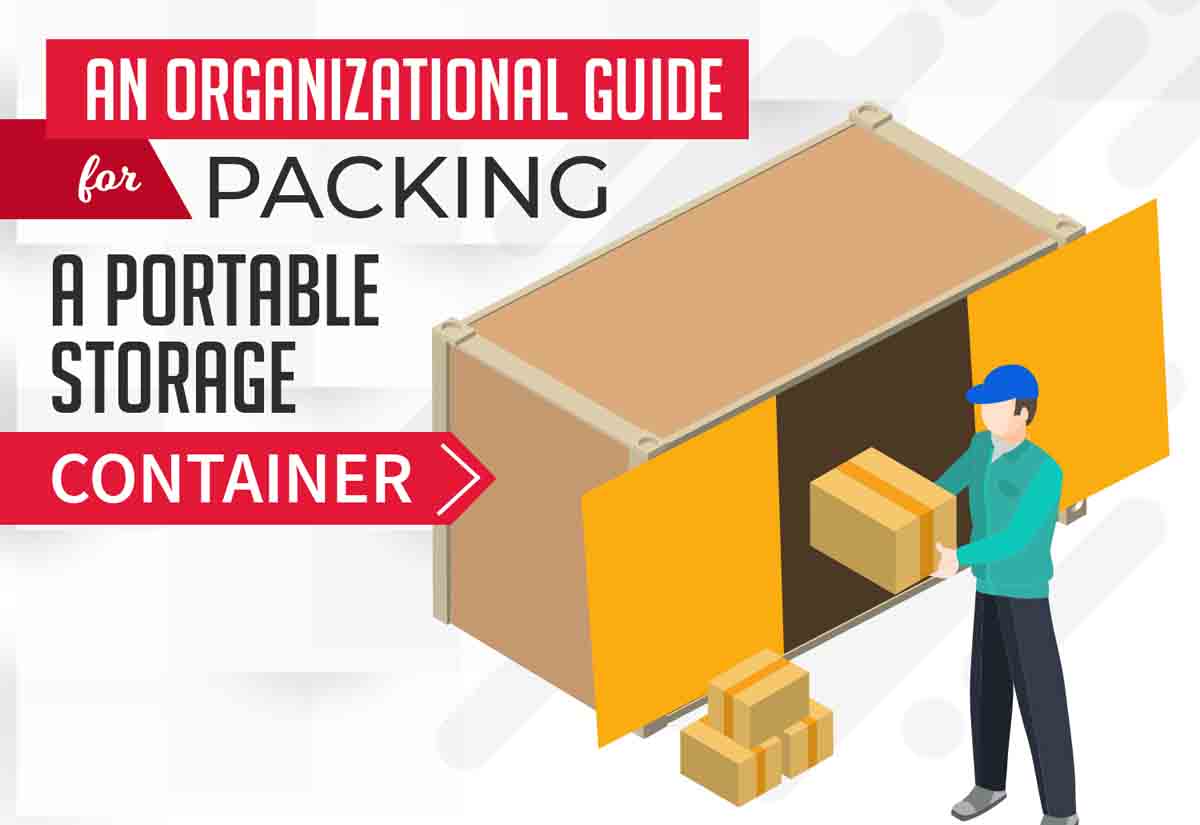
Getting Organized With Portable Storage
In the following infographic, SMARTBOX Solutions takes a look at everything you need to know about how to get organized and have a successful moving experience with a portable storage unit.

Everything You Need To Know About Reclaimed Wood
Reclaimed wood creates a unique look to the home providing an older element that has distinction and character. Reclaimed wood can be added to the home in a variety of ways, from flooring to stair treads, ceiling wood beams, furniture, wood panels, fireplace mantels and more. When you have reclaimed wood in your home, it is important to learn how to properly care for the wood.

The Ins and Outs of Rugby
In the following infographic, courtesy of Rhino Rugby, discover everything you need to know about individual and team oriented rugby equipment. [Click here for full size version]
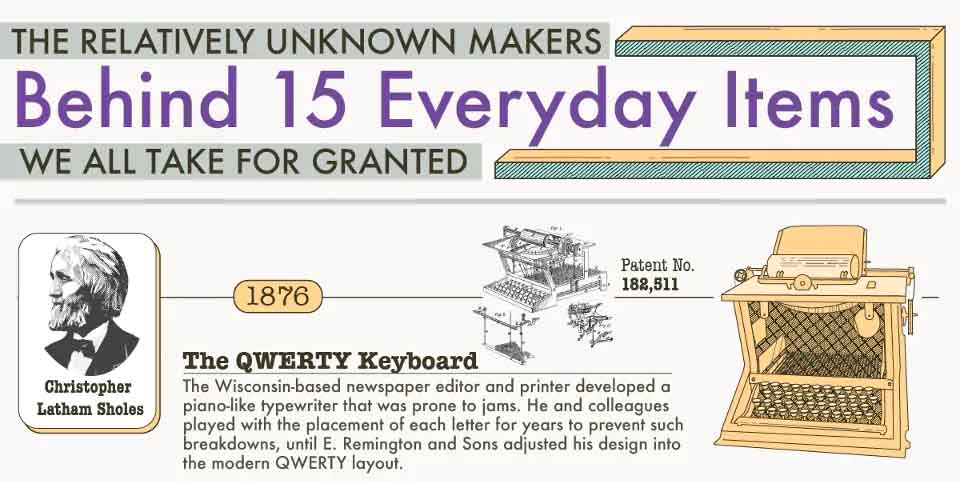
The Unknown Makers Behind Everyday Items We Take for Granted
It’s likely that today, you may have started the dishwasher, checked your home security system, packed a sandwich, put a ballpoint pen in your pocket, wiped the rain off your car with the windshield wipers, paused at a traffic light, and sat down at a keyboard. But who are the makers behind these everyday inventions we take for granted? There are dozens of relatively unknown inventors, and their inventions have absolutely changed the landscape of modern life.
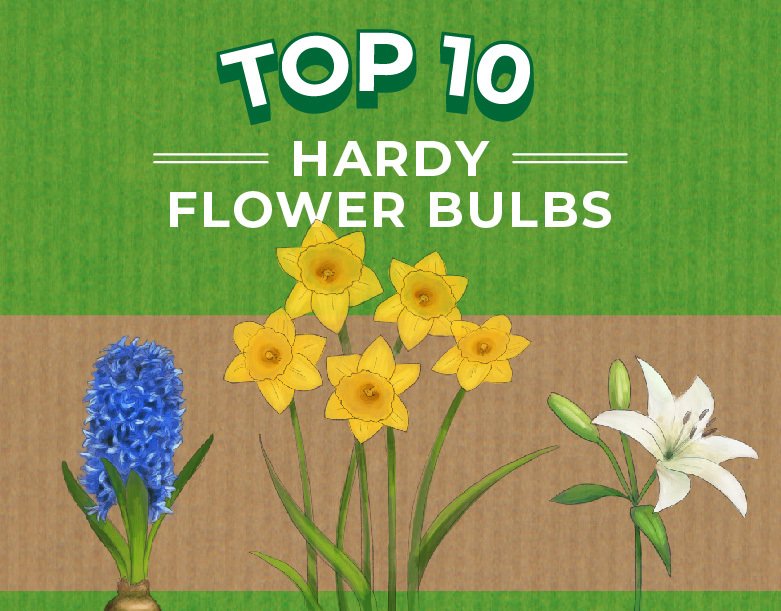
Top 10 Hardy Flower Bulbs
As some of the easiest plants to grow, hardy flower bulbs add a splash of color to borders, beds & containers. For a succession of blooms all year long, you can plant spring, summer and autumn flowers – such as hyacinth, cyclamen or daffodils. And with a wide range of colors and scents, you can grow hardy bulbs anywhere in the UK and beyond. For your eyes only, the team at Thompson & Morgan has created the following infographic that shows off their top picks of flower bulbs.

Acupuncture For Neck Pain: How Does it Work?
For the past recent years, doctors and medical experts around the world have studied several ways that can help alleviate neck pain, including acupuncture. Contrary to what many people know, acupuncture is already recognized worldwide as an effective treatment for chronic pain conditions. In fact, an analysis of 29 studies about acupuncture found that such treatment has successfully helped people with back and neck pain to feel better than those who had no treatment.

What is Viral Marketing and Why Your Business Needs It
Viral marketing is a business strategy and the reason behind the humongous success of various brands. If you’re planning to create a viral marketing campaign, here’s an infographic by Shiprocket that includes the things you need to know to have a successful viral campaign.

45 Beverages Ranked by Caffeine Per Ounce
For those of you who love caffeine, the following infographic from Sleepopolis compares the caffeine content in popular beverages like coffee, tea, and soda. It compares types of coffee and tea with one another, and also caffeine content in beverages offered by popular chains like Dunkin Donuts, Starbucks, Tim Horton’s and more.
Doing It Their Way: Gen Z And Entrepreneurship
Gen Z is shaping up to be one of the most entrepreneurial generations in history, but why? Watching their elders get kicked around by a bad economy is just one of the reasons. Learn more about GenZ and entrepreneurship within this infographic from Online Schools Center.
The Art And Science Of Scalability
When you start a business, chances are future growth is the furthest thing from your mind. That’s why you need to learn more about the art and science of scalability, as outlined in this infographic.
Getting Organized With Portable Storage
In the following infographic, SMARTBOX Solutions takes a look at everything you need to know about how to get organized and have a successful moving experience with a portable storage unit.
Everything You Need To Know About Reclaimed Wood
Reclaimed wood creates a unique look to the home providing an older element that has distinction and character. Reclaimed wood can be added to the home in a variety of ways, from flooring to stair treads, ceiling wood beams, furniture, wood panels, fireplace mantels and more. When you have reclaimed wood in your home, it is important to learn how to properly care for the wood.
The Ins and Outs of Rugby
In the following infographic, courtesy of Rhino Rugby, discover everything you need to know about individual and team oriented rugby equipment. [Click here for full size version]
The Unknown Makers Behind Everyday Items We Take for Granted
It’s likely that today, you may have started the dishwasher, checked your home security system, packed a sandwich, put a ballpoint pen in your pocket, wiped the rain off your car with the windshield wipers, paused at a traffic light, and sat down at a keyboard. But who are the makers behind these everyday inventions we take for granted? There are dozens of relatively unknown inventors, and their inventions have absolutely changed the landscape of modern life.
Top 10 Hardy Flower Bulbs
As some of the easiest plants to grow, hardy flower bulbs add a splash of color to borders, beds & containers. For a succession of blooms all year long, you can plant spring, summer and autumn flowers – such as hyacinth, cyclamen or daffodils. And with a wide range of colors and scents, you can grow hardy bulbs anywhere in the UK and beyond. For your eyes only, the team at Thompson & Morgan has created the following infographic that shows off their top picks of flower bulbs.
Acupuncture For Neck Pain: How Does it Work?
For the past recent years, doctors and medical experts around the world have studied several ways that can help alleviate neck pain, including acupuncture. Contrary to what many people know, acupuncture is already recognized worldwide as an effective treatment for chronic pain conditions. In fact, an analysis of 29 studies about acupuncture found that such treatment has successfully helped people with back and neck pain to feel better than those who had no treatment.
What is Viral Marketing and Why Your Business Needs It
Viral marketing is a business strategy and the reason behind the humongous success of various brands. If you’re planning to create a viral marketing campaign, here’s an infographic by Shiprocket that includes the things you need to know to have a successful viral campaign.
45 Beverages Ranked by Caffeine Per Ounce
For those of you who love caffeine, the following infographic from Sleepopolis compares the caffeine content in popular beverages like coffee, tea, and soda. It compares types of coffee and tea with one another, and also caffeine content in beverages offered by popular chains like Dunkin Donuts, Starbucks, Tim Horton’s and more.
Partners


Browse Archives By Category
Animated Infographics
Business Infographics
Career & Jobs Infographics
Education Infographics
Entertainment Industry Infographics
Environmental Infographics
Finance & Money Infographics
Food & Drink Infographics
Health Infographics
Historical Infographics
Home & Garden Infographics
Internet Infographics
Law and Legal Infographics
Lifestyle Infographics
Marketing Infographics
Offbeat Infographics
Parenting Infographics
Pets & Animals Infographics
Political Infographics
Shopping Infographics
Sports and Athletic Infographics
Technology Infographics
Transportation Infographics
Travel Infographics
Video Infographics