


Search 12,100+ Infographics!
Causes of Blurry Vision
Blurry vision is usually one of the most common conditions that results in decreased visual clarity. It starts with the surface of the eye, the cornea and this is where majority of the blurry vision lies. If you suffer from conditions such as near-sightedness, far sightedness and astigmatism, you may be susceptible to blurry vision. Let’s understand better with the help of this infographic.
Know Your Rights: Marijuana And Illegal Drugs In The Workplace
Despite the fact that cannabis is being legalized more places than ever, workplace drug testing will still take place. Learn more about your rights and responsibilities when it comes to drug testing from this infographic from US Drug Test Centers.

Hacking College Debt: 4 Steps to Save Years of Financial Problems
College debt is a growing problem, and it’s shaping the lives of recent grads by limiting opportunities, increasing financial pressure, and restricting personal milestones. However, college students aren’t without choices. By making smart decisions during the college years, it’s possible to avoid college debt altogether. OneClass has put together this blueprint to graduating college with zero debt.

The Evolution of the Presidential Car
Americans have a longstanding fascination with the way things work. From that fixation has grown a culture of innovators and pioneers, with politics and cars being no exception. This infographic breaks down the history and evolution of the presidential state cars, from the first Model M Steamer in 1909 to the Cadillac One nicknamed ‘The Beast.’
Five Different Types of Alcoholics
No alcoholic is the same. However, it is possible to place the alcoholic demographic into 5 relatively distinct types. This infographic provides the facts you need to know about what those 5 types are and how each type member is affected by alcoholism. However, all of the demographic require professional alcohol detox and rehab in order to change their lives for the better.
20 Natural Insomnia Cures (And the Science Behind Them)
Roughly 60 million Americans suffer from insomnia each year. This infographic provides 20 natural insomnia cures and explores the science and tradition behind them. Some methods are backed substantially by research, such as melatonin, physical activity, and lavender oil. Other methods are facets of traditional medicine from around the world, such as dried jujube, poetry, and worry dolls.

The Keys to Having a Positive Car Shopping Experience
As is the case with many large purchases, shopping for a new car can be a stressful experience. With so many different factors and configurations to consider, finding the vehicle that best suits your needs and wants may seem like a daunting task. Luckily, people have been buying and selling cars for decades now, and many helpful pointers have cropped up to help those in need.
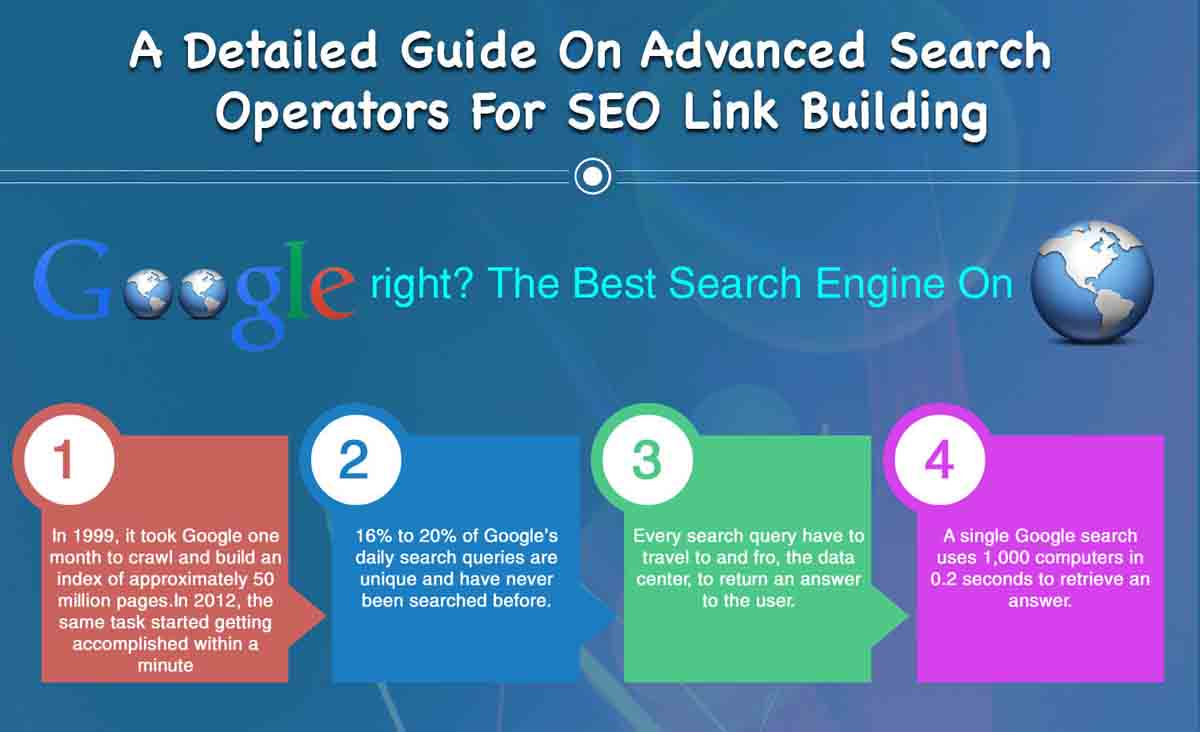
Advanced Search Operators for SEO Link Building
In the past, SEO experts used direct submissions and SEO tools to get links. These outdated tools and tactics are no longer useful. In fact, a few of the old techniques can actually attract penalization from Google. Today, most webmasters are well versed with the advanced SEO tactics to find link building opportunities but analyzing these activities through Google Search is a whole new ball game.
How Gen Z Is Confronting Their Financial Fears
Gen Z looks to be entering one of the toughest economic climates of generations, with stagnating wages and skyrocketing costs of living. Take a look at this infographic to learn how they are facing their financial fears.
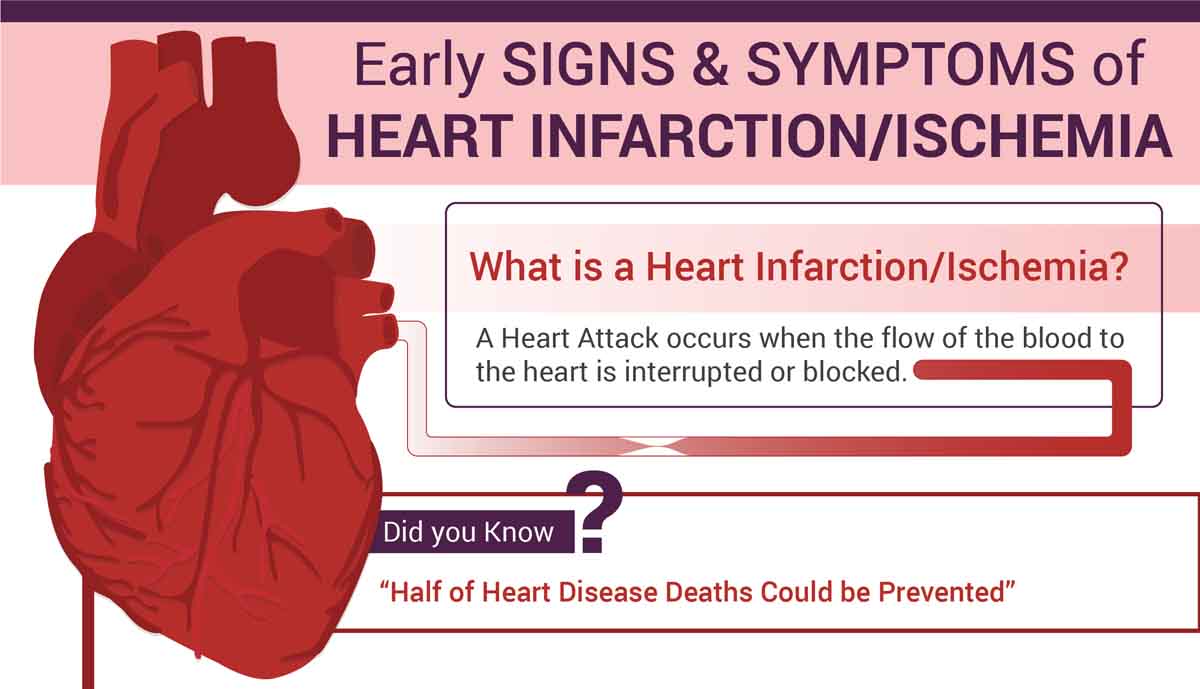
Early Signs & Symptoms of Heart Disease
A heart attack or Myocardial Infarction occurs when the flow of blood to the heart is blocked. It can be fatal, but treatment has improved dramatically over the years. The classic symptoms of heart attack include a severe chest pain spread to jaw, neck & back, shortness of breath & heartburn. Understanding early warning signs of heart attack is critical for prompt recognition to avoid serious complications.
Causes of Blurry Vision
Blurry vision is usually one of the most common conditions that results in decreased visual clarity. It starts with the surface of the eye, the cornea and this is where majority of the blurry vision lies. If you suffer from conditions such as near-sightedness, far sightedness and astigmatism, you may be susceptible to blurry vision. Let’s understand better with the help of this infographic.
Know Your Rights: Marijuana And Illegal Drugs In The Workplace
Despite the fact that cannabis is being legalized more places than ever, workplace drug testing will still take place. Learn more about your rights and responsibilities when it comes to drug testing from this infographic from US Drug Test Centers.
Hacking College Debt: 4 Steps to Save Years of Financial Problems
College debt is a growing problem, and it’s shaping the lives of recent grads by limiting opportunities, increasing financial pressure, and restricting personal milestones. However, college students aren’t without choices. By making smart decisions during the college years, it’s possible to avoid college debt altogether. OneClass has put together this blueprint to graduating college with zero debt.
The Evolution of the Presidential Car
Americans have a longstanding fascination with the way things work. From that fixation has grown a culture of innovators and pioneers, with politics and cars being no exception. This infographic breaks down the history and evolution of the presidential state cars, from the first Model M Steamer in 1909 to the Cadillac One nicknamed ‘The Beast.’
Five Different Types of Alcoholics
No alcoholic is the same. However, it is possible to place the alcoholic demographic into 5 relatively distinct types. This infographic provides the facts you need to know about what those 5 types are and how each type member is affected by alcoholism. However, all of the demographic require professional alcohol detox and rehab in order to change their lives for the better.
20 Natural Insomnia Cures (And the Science Behind Them)
Roughly 60 million Americans suffer from insomnia each year. This infographic provides 20 natural insomnia cures and explores the science and tradition behind them. Some methods are backed substantially by research, such as melatonin, physical activity, and lavender oil. Other methods are facets of traditional medicine from around the world, such as dried jujube, poetry, and worry dolls.
The Keys to Having a Positive Car Shopping Experience
As is the case with many large purchases, shopping for a new car can be a stressful experience. With so many different factors and configurations to consider, finding the vehicle that best suits your needs and wants may seem like a daunting task. Luckily, people have been buying and selling cars for decades now, and many helpful pointers have cropped up to help those in need.
Advanced Search Operators for SEO Link Building
In the past, SEO experts used direct submissions and SEO tools to get links. These outdated tools and tactics are no longer useful. In fact, a few of the old techniques can actually attract penalization from Google. Today, most webmasters are well versed with the advanced SEO tactics to find link building opportunities but analyzing these activities through Google Search is a whole new ball game.
How Gen Z Is Confronting Their Financial Fears
Gen Z looks to be entering one of the toughest economic climates of generations, with stagnating wages and skyrocketing costs of living. Take a look at this infographic to learn how they are facing their financial fears.
Early Signs & Symptoms of Heart Disease
A heart attack or Myocardial Infarction occurs when the flow of blood to the heart is blocked. It can be fatal, but treatment has improved dramatically over the years. The classic symptoms of heart attack include a severe chest pain spread to jaw, neck & back, shortness of breath & heartburn. Understanding early warning signs of heart attack is critical for prompt recognition to avoid serious complications.
Partners


Browse Archives By Category
Animated Infographics
Business Infographics
Career & Jobs Infographics
Education Infographics
Entertainment Industry Infographics
Environmental Infographics
Finance & Money Infographics
Food & Drink Infographics
Health Infographics
Historical Infographics
Home & Garden Infographics
Internet Infographics
Law and Legal Infographics
Lifestyle Infographics
Marketing Infographics
Offbeat Infographics
Parenting Infographics
Pets & Animals Infographics
Political Infographics
Shopping Infographics
Sports and Athletic Infographics
Technology Infographics
Transportation Infographics
Travel Infographics
Video Infographics