


Search 12,100+ Infographics!
The Consumer Buying Behavior in the Digital Age
Technology has transformed our lives in many ways—most notably, the way people shop. Back then, there were not that many options when it comes to the process of purchasing. You must go to a store, ask for more information, check for the lowest prices, and then make the decision. Nowadays, with help from a smartphone and a good internet connection, you can do all of these steps and more within the comfort of your home, or just about anywhere else.

12 Days of Feastmas
Brits love tucking into a good old turkey dinner on Christmas Day, but what can you expect to be served when you’re spending your Christmas elsewhere in the world? From a not-quite-so-romantic KFC bucket in Japan to barbecued meat in Australia, this infographic might make you think that the Brits do it best… until you get to the rum fruitcake of Jamaica and the finger-liking fish dishes of Italy.
Deep Learning and the Future of Facial Recognition
This infographic provides an exploration into what facial recognition technology is, how it’s currently being used and perhaps, most importantly, its pros and cons.
Who’s Riding the Cryptocurrency Wave?
On December 17, 2017, Bitcoin stock reached an all-time high of $20,089 per BTC. While this figure attracted people equipped with dreams of striking it rich quickly, others looked beyond its value to ponder the exciting possibilities that may exist within cryptocurrency and blockchain technology.
Healthcare Jobs 2.0
By 2030, 171 million Americans will have some form of chronic disease, and the U.S. will face a shortage of up to 104,900 physicians. Healthcare workers are going to have to find a way to keep up with growing need. At the heart of the healthcare jobs of the future is technology. Learn more about healthcare jobs of the future within this infographic.

US to UK Men’s Clothing Translation
Have you ever wondered why the British blush when you compliment their pants? You might think that the US has a lot in common with their UK cousins across the pond, but all those different words and slight variations in vocabulary can lead to some pretty awkward misunderstandings! Check out this handy guide to the most commonly confusing clothing translations.
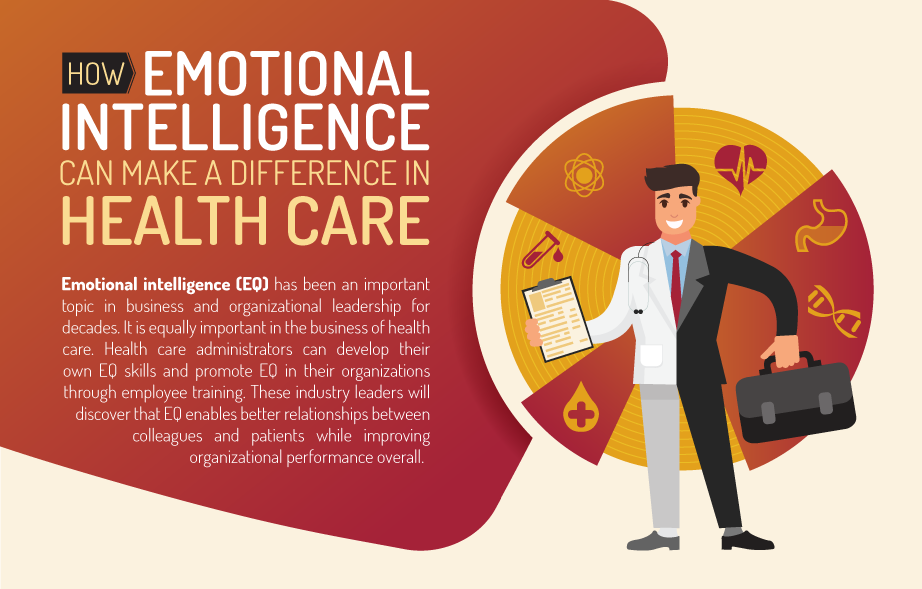
How Emotional Intelligence Can Make a Difference in Health Care
Emotional intelligence (EQ) has been an important topic in business and organizational leadership for decades. It’s equally important in the health care business. Health care administrators can develop their own EQ skills, and they can also promote EQ in their organizations via employee training.
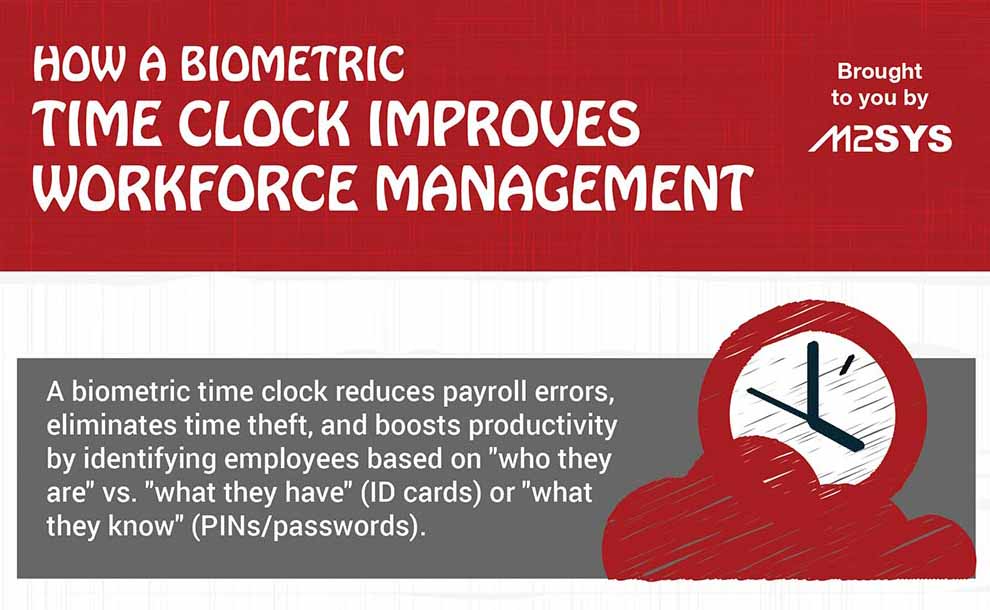
How A Biometric Time Clock Improves Workforce Management
A biometric time clock is a viable solution to eliminate time theft and improve workforce management. The following Infographic by M2SYS Technology demonstrates why biometric time clock deployments are increasing and what benefits employers can expect to see post implementation.
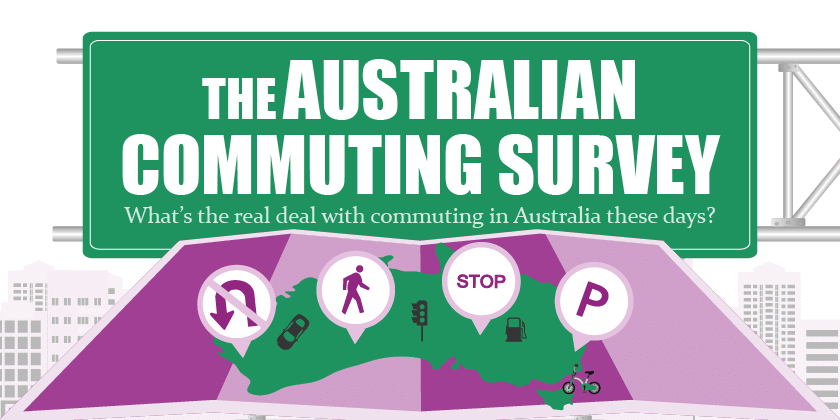
The Australian Commuting Survey
There will always be those who bounce out of bed each morning, eagerly awaiting the challenges and rewards that the new working day holds. But for many, the demands of their jobs are made all the more tiring and difficult thanks to a stressful work commute. The added pressure of the work commute, among several other findings, is at the center of the Australian Commuting Survey.
The Future of Education Technology
It’s virtually impossible to name an industry that hasn’t been transformed by technology. Education is no exception. From Apple computers to smartphones, iPads, and virtual reality, students and teachers are embracing the exciting educational opportunities offered by technology. American University’s School of Education has created the following infographic which looks at the future of education technology.
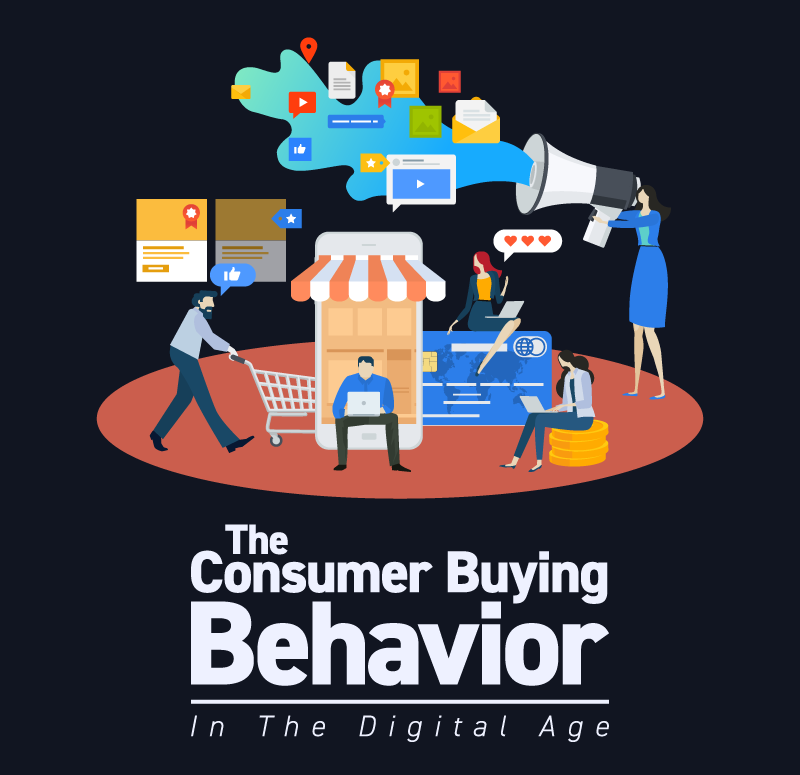
The Consumer Buying Behavior in the Digital Age
Technology has transformed our lives in many ways—most notably, the way people shop. Back then, there were not that many options when it comes to the process of purchasing. You must go to a store, ask for more information, check for the lowest prices, and then make the decision. Nowadays, with help from a smartphone and a good internet connection, you can do all of these steps and more within the comfort of your home, or just about anywhere else.
12 Days of Feastmas
Brits love tucking into a good old turkey dinner on Christmas Day, but what can you expect to be served when you’re spending your Christmas elsewhere in the world? From a not-quite-so-romantic KFC bucket in Japan to barbecued meat in Australia, this infographic might make you think that the Brits do it best… until you get to the rum fruitcake of Jamaica and the finger-liking fish dishes of Italy.
Deep Learning and the Future of Facial Recognition
This infographic provides an exploration into what facial recognition technology is, how it’s currently being used and perhaps, most importantly, its pros and cons.
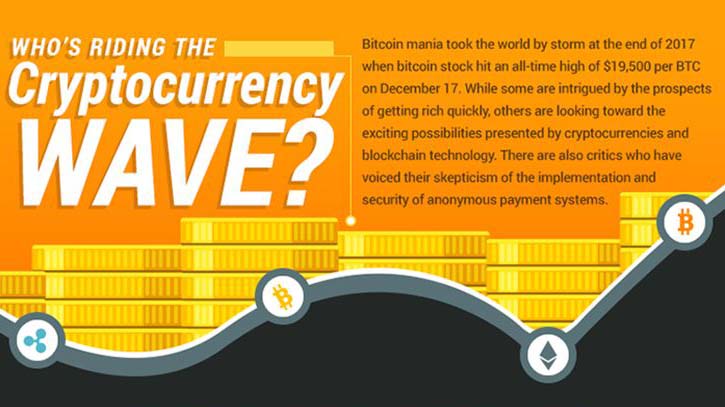
Who’s Riding the Cryptocurrency Wave?
On December 17, 2017, Bitcoin stock reached an all-time high of $20,089 per BTC. While this figure attracted people equipped with dreams of striking it rich quickly, others looked beyond its value to ponder the exciting possibilities that may exist within cryptocurrency and blockchain technology.
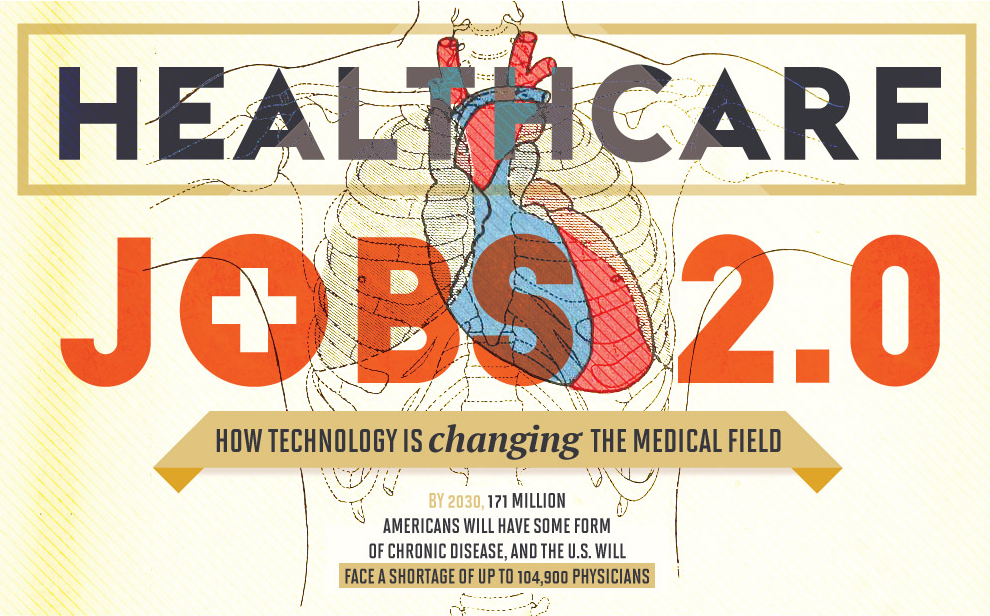
Healthcare Jobs 2.0
By 2030, 171 million Americans will have some form of chronic disease, and the U.S. will face a shortage of up to 104,900 physicians. Healthcare workers are going to have to find a way to keep up with growing need. At the heart of the healthcare jobs of the future is technology. Learn more about healthcare jobs of the future within this infographic.
US to UK Men’s Clothing Translation
Have you ever wondered why the British blush when you compliment their pants? You might think that the US has a lot in common with their UK cousins across the pond, but all those different words and slight variations in vocabulary can lead to some pretty awkward misunderstandings! Check out this handy guide to the most commonly confusing clothing translations.
How Emotional Intelligence Can Make a Difference in Health Care
Emotional intelligence (EQ) has been an important topic in business and organizational leadership for decades. It’s equally important in the health care business. Health care administrators can develop their own EQ skills, and they can also promote EQ in their organizations via employee training.
How A Biometric Time Clock Improves Workforce Management
A biometric time clock is a viable solution to eliminate time theft and improve workforce management. The following Infographic by M2SYS Technology demonstrates why biometric time clock deployments are increasing and what benefits employers can expect to see post implementation.
The Australian Commuting Survey
There will always be those who bounce out of bed each morning, eagerly awaiting the challenges and rewards that the new working day holds. But for many, the demands of their jobs are made all the more tiring and difficult thanks to a stressful work commute. The added pressure of the work commute, among several other findings, is at the center of the Australian Commuting Survey.
The Future of Education Technology
It’s virtually impossible to name an industry that hasn’t been transformed by technology. Education is no exception. From Apple computers to smartphones, iPads, and virtual reality, students and teachers are embracing the exciting educational opportunities offered by technology. American University’s School of Education has created the following infographic which looks at the future of education technology.
Partners


Browse Archives By Category
Animated Infographics
Business Infographics
Career & Jobs Infographics
Education Infographics
Entertainment Industry Infographics
Environmental Infographics
Finance & Money Infographics
Food & Drink Infographics
Health Infographics
Historical Infographics
Home & Garden Infographics
Internet Infographics
Law and Legal Infographics
Lifestyle Infographics
Marketing Infographics
Offbeat Infographics
Parenting Infographics
Pets & Animals Infographics
Political Infographics
Shopping Infographics
Sports and Athletic Infographics
Technology Infographics
Transportation Infographics
Travel Infographics
Video Infographics