


Search 12,100+ Infographics!
Which World Currencies Have Been in Continuous Use the Longest?
There are many coin and bill collectors out there, likely because money is such a fascinating look into a country’s history and heritage. Coins often contain symbols of historical events, figures, and cultural significance. Physical currency has a long, rich history around the world, but which currencies are still in circulation have been around the longest?

The Largest Company by Market Cap in Every Sector and Industry
LLC Attorney’s team provided an insightful infographic to investors and market enthusiasts, showcasing the leading companies across various sectors as of Q3 2024. The detailed graphic ranks companies by market gap and organizes them by industry, making it simple to compare key players at a glance.

The Biggest Companies in the US by Revenue Each Year Since 1955
Most Americans are familiar with today’s top 10 biggest Fortune 500 companies, but looking at a history of most profitable companies reveals names that have faded from memory. The team at LLCAttorney created a fascinating timeline tracking the 10 companies that earned the most revenue every year since 1955.

The 25 Oldest Churches in the World
The team at AAA State of Play set out to find out which church structure is the oldest in the world. Their infographic gives us some gorgeous, illustrated insight into the world’s oldest churches. We can find out where they’re located, what religion they serve, and a little bit of their history. But the question of which is oldest turns out to be a bit difficult to answer.
The Biggest Boat and Yacht Manufacturers Ranked by Revenue Per Second
Yachts are synonymous with luxury, evoking images of sun-soaked days, elite gatherings, and the lifestyle of the rich and famous. But have you ever wondered just how much yacht manufacturers rake in? SI Yachts has crafted an infographic that reveals the brands generating the highest revenue per second.

Which U.S. States Have the Most and the Fewest Public Schools Per Capita?
Public schools are essential to a healthy society. They provide a place for children to learn needed skills, gain knowledge, make friends, get a free meal, and explore new interests. Research shows that kids with a strong education are less likely to turn to crime, have poor health, or need government assistance.

WhatsApp for Project Management – 19 Pitfalls To Consider
In today’s fast-paced world, efficient project management solutions are critical to effectively completing projects. WhatsApp is a popular messaging service used by millions of people worldwide. In the following infographic, GO-Globe look at 19 pitfalls to consider when using WhatsApp for project management.

Live Streaming Revolution: From Niche To Mainstream & Beyond
Over the last couple of years, there has been a significant change in the live streaming sector, shifting it from a specialized pastime to a widely popular trend. It keeps pushing the limits of digital interaction – an online revolution driven by technological progress. This infographic examines the progress of live streaming in recent years and its potential as a significant advancement in the future.

What is the Best State for Family-Friendly Vacations?
The team at Florida Rentals decided to determine which U.S. states are the best for family vacations. Maybe it’s no surprise that their home state ranked at #1! But before you think they were biased, take a deeper look at their infographic where they not only ranked every U.S. state but laid out the method they used to determine the rankings.

Which States Have the Best Sex?
The team at NapLab put together a huge, fascinating study that represented 23.6% of Americans who rated the quality of their sex lives on a scale of 1 to 10. Based on the results, American enjoyment of sex might be in trouble, as the average score was a 4.7, which isn’t a very high one. There’s a huge variance among states with 25 states rating above this number and 25 rating below it.
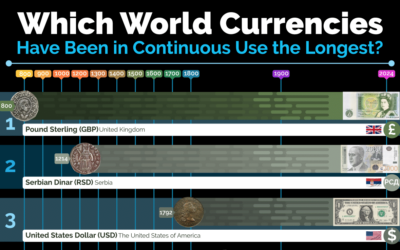
Which World Currencies Have Been in Continuous Use the Longest?
There are many coin and bill collectors out there, likely because money is such a fascinating look into a country’s history and heritage. Coins often contain symbols of historical events, figures, and cultural significance. Physical currency has a long, rich history around the world, but which currencies are still in circulation have been around the longest?
The Largest Company by Market Cap in Every Sector and Industry
LLC Attorney’s team provided an insightful infographic to investors and market enthusiasts, showcasing the leading companies across various sectors as of Q3 2024. The detailed graphic ranks companies by market gap and organizes them by industry, making it simple to compare key players at a glance.
The Biggest Companies in the US by Revenue Each Year Since 1955
Most Americans are familiar with today’s top 10 biggest Fortune 500 companies, but looking at a history of most profitable companies reveals names that have faded from memory. The team at LLCAttorney created a fascinating timeline tracking the 10 companies that earned the most revenue every year since 1955.
The 25 Oldest Churches in the World
The team at AAA State of Play set out to find out which church structure is the oldest in the world. Their infographic gives us some gorgeous, illustrated insight into the world’s oldest churches. We can find out where they’re located, what religion they serve, and a little bit of their history. But the question of which is oldest turns out to be a bit difficult to answer.
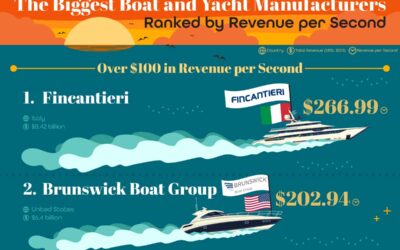
The Biggest Boat and Yacht Manufacturers Ranked by Revenue Per Second
Yachts are synonymous with luxury, evoking images of sun-soaked days, elite gatherings, and the lifestyle of the rich and famous. But have you ever wondered just how much yacht manufacturers rake in? SI Yachts has crafted an infographic that reveals the brands generating the highest revenue per second.
Which U.S. States Have the Most and the Fewest Public Schools Per Capita?
Public schools are essential to a healthy society. They provide a place for children to learn needed skills, gain knowledge, make friends, get a free meal, and explore new interests. Research shows that kids with a strong education are less likely to turn to crime, have poor health, or need government assistance.
WhatsApp for Project Management – 19 Pitfalls To Consider
In today’s fast-paced world, efficient project management solutions are critical to effectively completing projects. WhatsApp is a popular messaging service used by millions of people worldwide. In the following infographic, GO-Globe look at 19 pitfalls to consider when using WhatsApp for project management.
Live Streaming Revolution: From Niche To Mainstream & Beyond
Over the last couple of years, there has been a significant change in the live streaming sector, shifting it from a specialized pastime to a widely popular trend. It keeps pushing the limits of digital interaction – an online revolution driven by technological progress. This infographic examines the progress of live streaming in recent years and its potential as a significant advancement in the future.
What is the Best State for Family-Friendly Vacations?
The team at Florida Rentals decided to determine which U.S. states are the best for family vacations. Maybe it’s no surprise that their home state ranked at #1! But before you think they were biased, take a deeper look at their infographic where they not only ranked every U.S. state but laid out the method they used to determine the rankings.
Which States Have the Best Sex?
The team at NapLab put together a huge, fascinating study that represented 23.6% of Americans who rated the quality of their sex lives on a scale of 1 to 10. Based on the results, American enjoyment of sex might be in trouble, as the average score was a 4.7, which isn’t a very high one. There’s a huge variance among states with 25 states rating above this number and 25 rating below it.
Partners


Browse Archives By Category
Animated Infographics
Business Infographics
Career & Jobs Infographics
Education Infographics
Entertainment Industry Infographics
Environmental Infographics
Finance & Money Infographics
Food & Drink Infographics
Health Infographics
Historical Infographics
Home & Garden Infographics
Internet Infographics
Law and Legal Infographics
Lifestyle Infographics
Marketing Infographics
Offbeat Infographics
Parenting Infographics
Pets & Animals Infographics
Political Infographics
Shopping Infographics
Sports and Athletic Infographics
Technology Infographics
Transportation Infographics
Travel Infographics
Video Infographics