


Search 12,100+ Infographics!

The Rise of Short Video Content
With the advent of short video content, social media usage has changed entirely. For example, platforms like Instagram and TikTok switched to it. This drastic rise in the acceptance of such content has led companies to redesign their tactics to reach out to their audience. Middle Eastern businesses need to keep up with these changes.
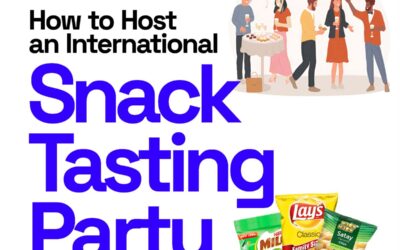
How To Host An International Snack Tasting Party
An International Snack Tasting Party is the perfect way to explore global cultures through food, all while creating a fun and memorable experience for your guests. This step-by-step guide courtesy of TastyFinds will help you plan an exciting event, starting with choosing a theme that reflects the type of exotic snacks you’ll showcase.

Dark Mode Statistics
Dark Mode is becoming more popular these days. It features light text on a dark background. People love it for its appeal and health advantages. It also conserves energy on OLED screens found in numerous smartphones. In the following infographic, Go-Globe looks at dark mode statistics.

Which Auto Manufacturers Have Had The Most Safety Recalls?
In the years since 2010, Ford Motor Company has issued 545 safety recalls. Though Ford did not rank at the top every year for most recalls, they have ranked first consecutively since 2021. In the following infographic, Automotive Touch Up Paint looks at which auto manufacturers have had the most safety recalls.

Which U.S. States Have Had the Most Human Trafficking Victims Over the Past 5 Years?
Since the main sources of data over human trafficking come from identified victims, there is some challenges in measuring and monitoring such a crime. Many individuals don’t know the signs of someone being trafficked, and those that are trafficked often do not realize it. In the following infographic, look at the U.S. States that have had the most human trafficking victims over the past 5 years.
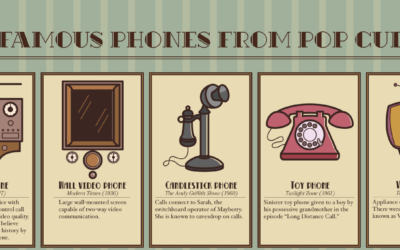
45 Famous Phones From Pop Culture
Film makers use all kinds of props and visual clues to give us hints about the plot or to develop the world and characters. The team at Ooma showed us 45 examples with this infographic displaying 45 of pop culture’s most famous phones. The infographic is arranged as a timeline showing these phones in chronological order of their appearance on screen.

The Big Five Film Studios & Their Acquisitions
Hollywood may bring to mind glamor and excitement, but behind the scenes there are cutthroat business practices going on which involve giant studios absorbing all their competition. Corporate mergers in Hollywood are changing the landscape of the film industry.
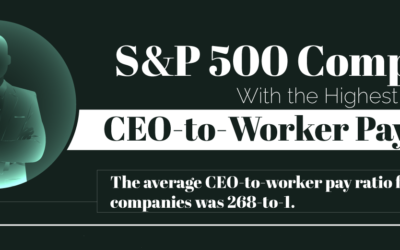
The Ratio of CEO to Worker Pay Visualized
The CEO to worker pay refers to the difference between the CEO’s salary and their average worker’s salary. In recent years, the subject of CEO to worker pay ratios have been a hot subject mostly because the gaps between them tend to widen. The team at Madison Trust Company shows us the status of these ratios at some of the business world’s top companies to illustrate the full spectrum of the issue.

The Most (and Least) Connected Cities in the United States
In today’s world it can be difficult to imagine life without an Internet connection, but some households and locations forgo an Internet connection. In some cases, it’s a personal choice, but in others, a rural location might hinder accessibility to the Internet. The team at Ooma sheds some light on the issue with this map of U.S. cities.

Colorado’s Mental Health Crisis By The Numbers
The numbers are staggering: more than a quarter of a million Coloradans report serious thoughts of suicide, and the state ranks near the bottom for its prevalence of mental illness. What’s driving this crisis? And more importantly, what can be done to reverse the trend? This infographic explains some of the contributors to Colorado’s worsening mental health crisis.
The Rise of Short Video Content
With the advent of short video content, social media usage has changed entirely. For example, platforms like Instagram and TikTok switched to it. This drastic rise in the acceptance of such content has led companies to redesign their tactics to reach out to their audience. Middle Eastern businesses need to keep up with these changes.
How To Host An International Snack Tasting Party
An International Snack Tasting Party is the perfect way to explore global cultures through food, all while creating a fun and memorable experience for your guests. This step-by-step guide courtesy of TastyFinds will help you plan an exciting event, starting with choosing a theme that reflects the type of exotic snacks you’ll showcase.
Dark Mode Statistics
Dark Mode is becoming more popular these days. It features light text on a dark background. People love it for its appeal and health advantages. It also conserves energy on OLED screens found in numerous smartphones. In the following infographic, Go-Globe looks at dark mode statistics.
Which Auto Manufacturers Have Had The Most Safety Recalls?
In the years since 2010, Ford Motor Company has issued 545 safety recalls. Though Ford did not rank at the top every year for most recalls, they have ranked first consecutively since 2021. In the following infographic, Automotive Touch Up Paint looks at which auto manufacturers have had the most safety recalls.
Which U.S. States Have Had the Most Human Trafficking Victims Over the Past 5 Years?
Since the main sources of data over human trafficking come from identified victims, there is some challenges in measuring and monitoring such a crime. Many individuals don’t know the signs of someone being trafficked, and those that are trafficked often do not realize it. In the following infographic, look at the U.S. States that have had the most human trafficking victims over the past 5 years.
45 Famous Phones From Pop Culture
Film makers use all kinds of props and visual clues to give us hints about the plot or to develop the world and characters. The team at Ooma showed us 45 examples with this infographic displaying 45 of pop culture’s most famous phones. The infographic is arranged as a timeline showing these phones in chronological order of their appearance on screen.
The Big Five Film Studios & Their Acquisitions
Hollywood may bring to mind glamor and excitement, but behind the scenes there are cutthroat business practices going on which involve giant studios absorbing all their competition. Corporate mergers in Hollywood are changing the landscape of the film industry.
The Ratio of CEO to Worker Pay Visualized
The CEO to worker pay refers to the difference between the CEO’s salary and their average worker’s salary. In recent years, the subject of CEO to worker pay ratios have been a hot subject mostly because the gaps between them tend to widen. The team at Madison Trust Company shows us the status of these ratios at some of the business world’s top companies to illustrate the full spectrum of the issue.
The Most (and Least) Connected Cities in the United States
In today’s world it can be difficult to imagine life without an Internet connection, but some households and locations forgo an Internet connection. In some cases, it’s a personal choice, but in others, a rural location might hinder accessibility to the Internet. The team at Ooma sheds some light on the issue with this map of U.S. cities.
Colorado’s Mental Health Crisis By The Numbers
The numbers are staggering: more than a quarter of a million Coloradans report serious thoughts of suicide, and the state ranks near the bottom for its prevalence of mental illness. What’s driving this crisis? And more importantly, what can be done to reverse the trend? This infographic explains some of the contributors to Colorado’s worsening mental health crisis.
Partners


Browse Archives By Category
Animated Infographics
Business Infographics
Career & Jobs Infographics
Education Infographics
Entertainment Industry Infographics
Environmental Infographics
Finance & Money Infographics
Food & Drink Infographics
Health Infographics
Historical Infographics
Home & Garden Infographics
Internet Infographics
Law and Legal Infographics
Lifestyle Infographics
Marketing Infographics
Offbeat Infographics
Parenting Infographics
Pets & Animals Infographics
Political Infographics
Shopping Infographics
Sports and Athletic Infographics
Technology Infographics
Transportation Infographics
Travel Infographics
Video Infographics