


Search 12,100+ Infographics!

Fundamentals of Green Packaging
Meeting your environmental responsibilities as a business – regardless of your platform – is more pressing than ever, what with the increasing number of consumers who are making the switch into green living. If you want to tap into this growing market, then operating a green e-commerce business is the only way to go.

8 Big Announcements From Google I/O 2018
At the recent Google I/O 2018 event, the company made 8 big announcements and also introduced several new tools for developers to make their apps and services better. Check out the following infographic from Infographic Design Team on the 8 announcements and how these changes will help you in your corporate and social life.
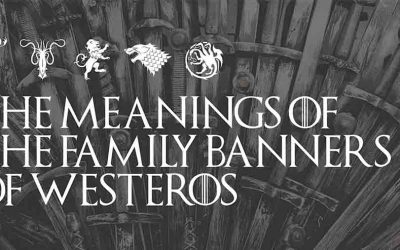
The Meanings of the Family Banners of Westeros
Here is a fascinating infographic from the folks at UK Feather Flags which takes a look at the meanings of the house banners from the TV show Game of Thrones. Check out information about the House Lannister banner, the House Stark banner, the House Targaryen banner and more.
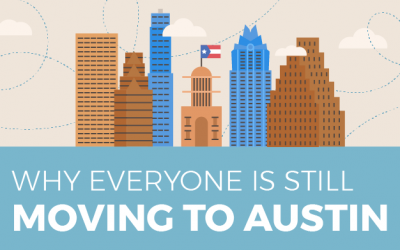
Why Everyone is STILL Moving to Austin
Austin is one of the fastest growing cities in the US, and for good reason. The economy is booming, the culture is fantastic, and the weather can’t be beaten. Roughly 50 people move to Austin every day. In the following infographic, Blue Whale Moving Company looks at why everyone is still moving to Austin.
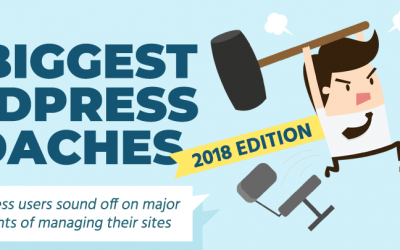
The Biggest WordPress Headaches of 2018
The team at Pagely surveyed a variety of WordPress users about the biggest challenges they face and the problems go far beyond managing their content and designing their presence on the web. Respondents said their biggest issues were performance Issues (52%), security issues (41%), and site-breaking updates (35%). Learn what the biggest WordPress headaches of 2018 are in the following infographic.
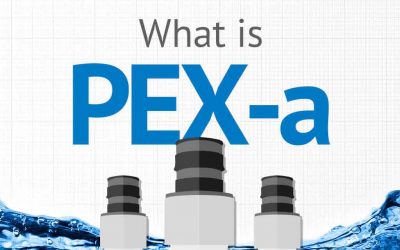
Best Pipes For Plumbing? PEX-a Pipes vs The Rest
When it comes to ensuring water safety and ease of installation, preventing wastage and saving on costs for your next building project or home, there is simply no equal to PEX-a pipes. Learn how this premium made plastic stacks up against other plastics and traditional metal materials within this infographic by Uponor.
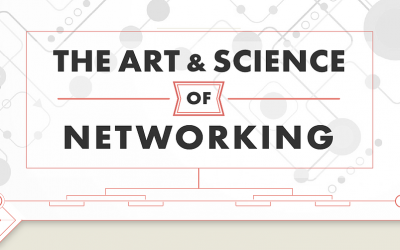
The Art & Science Of Networking
Networking is as much an art as it is a science. Learn more about some networking best practices within the following infographic from Networkwise. [Click image for full size version]

32 Reasons Why To Wear Watches
The following infographic courtesy of Tell Me Best is based on an exhaustive list of reasons: “Why We Should Wear Watches Today”. Since the smartphones advent, sales of watches have taken a hit. The list persuades people to embrace the accessory that was integral to the fashion statement in the past.
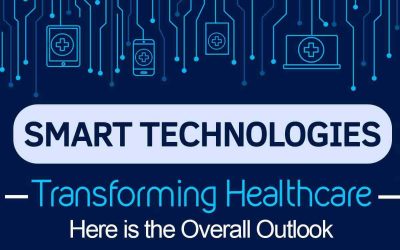
Smart Technologies Transforming Healthcare
Technology has made way for smart thinking. Unlike other industries, even healthcare providers are increasingly turning towards advanced technologies and Internet of Things for improving care services. That is why by 2020, it is expected that Global healthcare spending on smart technologies will reach $8.7 trillion. In this infographic, learn more about how smart technologies are transforming healthcare.
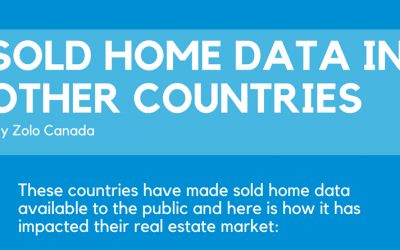
Sold Home Data in Other Countries
In the following infographic, learn about how countries throughout the world treat sold home data in global real estate markets, the differences across countries, and how it impacts the real estate market.
Fundamentals of Green Packaging
Meeting your environmental responsibilities as a business – regardless of your platform – is more pressing than ever, what with the increasing number of consumers who are making the switch into green living. If you want to tap into this growing market, then operating a green e-commerce business is the only way to go.
8 Big Announcements From Google I/O 2018
At the recent Google I/O 2018 event, the company made 8 big announcements and also introduced several new tools for developers to make their apps and services better. Check out the following infographic from Infographic Design Team on the 8 announcements and how these changes will help you in your corporate and social life.
The Meanings of the Family Banners of Westeros
Here is a fascinating infographic from the folks at UK Feather Flags which takes a look at the meanings of the house banners from the TV show Game of Thrones. Check out information about the House Lannister banner, the House Stark banner, the House Targaryen banner and more.
Why Everyone is STILL Moving to Austin
Austin is one of the fastest growing cities in the US, and for good reason. The economy is booming, the culture is fantastic, and the weather can’t be beaten. Roughly 50 people move to Austin every day. In the following infographic, Blue Whale Moving Company looks at why everyone is still moving to Austin.
The Biggest WordPress Headaches of 2018
The team at Pagely surveyed a variety of WordPress users about the biggest challenges they face and the problems go far beyond managing their content and designing their presence on the web. Respondents said their biggest issues were performance Issues (52%), security issues (41%), and site-breaking updates (35%). Learn what the biggest WordPress headaches of 2018 are in the following infographic.
Best Pipes For Plumbing? PEX-a Pipes vs The Rest
When it comes to ensuring water safety and ease of installation, preventing wastage and saving on costs for your next building project or home, there is simply no equal to PEX-a pipes. Learn how this premium made plastic stacks up against other plastics and traditional metal materials within this infographic by Uponor.
The Art & Science Of Networking
Networking is as much an art as it is a science. Learn more about some networking best practices within the following infographic from Networkwise. [Click image for full size version]
32 Reasons Why To Wear Watches
The following infographic courtesy of Tell Me Best is based on an exhaustive list of reasons: “Why We Should Wear Watches Today”. Since the smartphones advent, sales of watches have taken a hit. The list persuades people to embrace the accessory that was integral to the fashion statement in the past.
Smart Technologies Transforming Healthcare
Technology has made way for smart thinking. Unlike other industries, even healthcare providers are increasingly turning towards advanced technologies and Internet of Things for improving care services. That is why by 2020, it is expected that Global healthcare spending on smart technologies will reach $8.7 trillion. In this infographic, learn more about how smart technologies are transforming healthcare.
Sold Home Data in Other Countries
In the following infographic, learn about how countries throughout the world treat sold home data in global real estate markets, the differences across countries, and how it impacts the real estate market.
Partners


Browse Archives By Category
Animated Infographics
Business Infographics
Career & Jobs Infographics
Education Infographics
Entertainment Industry Infographics
Environmental Infographics
Finance & Money Infographics
Food & Drink Infographics
Health Infographics
Historical Infographics
Home & Garden Infographics
Internet Infographics
Law and Legal Infographics
Lifestyle Infographics
Marketing Infographics
Offbeat Infographics
Parenting Infographics
Pets & Animals Infographics
Political Infographics
Shopping Infographics
Sports and Athletic Infographics
Technology Infographics
Transportation Infographics
Travel Infographics
Video Infographics