


Search 12,100+ Infographics!

10 Most Expensive Cars Ever Sold at Auction
Here is an infographic from the team at the Auto Shippers website which takes a look at some of the priciest cars ever sold at auction. The piece includes the prices they sold for, where they were sold and when they were sold.
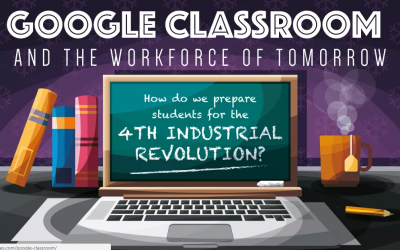
Google Classroom And The Workforce Of Tomorrow
Education budgets are being slashed all over the place. In light of this, can Google Classroom give students a chance to learn collaborative work practices for free? Learn more within this infographic from Best Education Degrees.
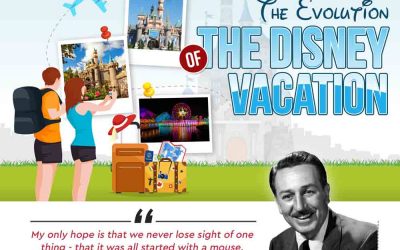
The Evolution of a Disney Vacation
In July of 1955, Walt Disney opened Disneyland in Anaheim, California. This was the beginning of what would become several Walt Disney Company vacation destinations. Since then, the magic of Disney has grown to destinations all across the globe. Check out this infographic by Magical Travel to go on a journey into the evolution of a Disney Vacation.

Rich Snippets
We see them everywhere in the SERPs, with some verticals having a higher abundance of them than others. Now how can increase your search click-through ratio with Snippets? The Infographic Design Team explores this further in the following infographic.

Disney Fox Merger
Disney’s acquisition of 21st Century Fox means that the House of Mouse now controls a huge amount of our most beloved films and television series. Announced in December 2017 and expected to take until at least 2021 to complete, this $66.1 billion deal ranks among the largest mergers of its kind in history. Read on to see how the merger will affect everything.

Why Choose Engineered Wood Flooring for Your Property
The following infographic describes the benefits and features of having your house fitted with Engineered Wood Flooring. Reap the benefits of a beautiful solid wood flooring that is easy to maintain and will last for decades that has an authentic feel and look.

Are We Smart or Addict?
Mobile phone overuse is a dependence syndrome prevalent in Millennials. The symptoms of smartphone addiction are hurting us daily. Learn about the effects, signs, and symptoms of smartphone addiction within this infographic.

Rise of Rooftop Energy Storage
Roof Stores has created the following infographic to highlight the emerging trends in rooftop solar energy. Read on to find out how attitudes are changing, and which countries are leading the way in solar energy.

23 Ideas for Marketers on What to Post at Instagram
With over 500 million daily users, Instagram offers a great platform for brands to engage their audience. Recent studies show that the engagement dividend brands stand to gain from this platform is much more than on other social networks. However, marketers often struggle to find the right content for this visual-first platform. This infographic features 23 content ideas which have had considerable success.
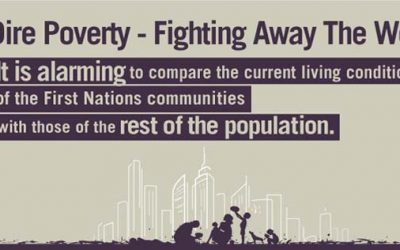
Fight Against Poverty
Despite the economic growth around the world in the last thirty years, global poverty still continues to be a major problem. Let’s take an oath to eradicate poverty from the world, once and for all. The following infographic takes a look at poverty and includes some ways to help end it.
10 Most Expensive Cars Ever Sold at Auction
Here is an infographic from the team at the Auto Shippers website which takes a look at some of the priciest cars ever sold at auction. The piece includes the prices they sold for, where they were sold and when they were sold.
Google Classroom And The Workforce Of Tomorrow
Education budgets are being slashed all over the place. In light of this, can Google Classroom give students a chance to learn collaborative work practices for free? Learn more within this infographic from Best Education Degrees.
The Evolution of a Disney Vacation
In July of 1955, Walt Disney opened Disneyland in Anaheim, California. This was the beginning of what would become several Walt Disney Company vacation destinations. Since then, the magic of Disney has grown to destinations all across the globe. Check out this infographic by Magical Travel to go on a journey into the evolution of a Disney Vacation.
Rich Snippets
We see them everywhere in the SERPs, with some verticals having a higher abundance of them than others. Now how can increase your search click-through ratio with Snippets? The Infographic Design Team explores this further in the following infographic.
Disney Fox Merger
Disney’s acquisition of 21st Century Fox means that the House of Mouse now controls a huge amount of our most beloved films and television series. Announced in December 2017 and expected to take until at least 2021 to complete, this $66.1 billion deal ranks among the largest mergers of its kind in history. Read on to see how the merger will affect everything.
Why Choose Engineered Wood Flooring for Your Property
The following infographic describes the benefits and features of having your house fitted with Engineered Wood Flooring. Reap the benefits of a beautiful solid wood flooring that is easy to maintain and will last for decades that has an authentic feel and look.
Are We Smart or Addict?
Mobile phone overuse is a dependence syndrome prevalent in Millennials. The symptoms of smartphone addiction are hurting us daily. Learn about the effects, signs, and symptoms of smartphone addiction within this infographic.
Rise of Rooftop Energy Storage
Roof Stores has created the following infographic to highlight the emerging trends in rooftop solar energy. Read on to find out how attitudes are changing, and which countries are leading the way in solar energy.
23 Ideas for Marketers on What to Post at Instagram
With over 500 million daily users, Instagram offers a great platform for brands to engage their audience. Recent studies show that the engagement dividend brands stand to gain from this platform is much more than on other social networks. However, marketers often struggle to find the right content for this visual-first platform. This infographic features 23 content ideas which have had considerable success.
Fight Against Poverty
Despite the economic growth around the world in the last thirty years, global poverty still continues to be a major problem. Let’s take an oath to eradicate poverty from the world, once and for all. The following infographic takes a look at poverty and includes some ways to help end it.
Partners


Browse Archives By Category
Animated Infographics
Business Infographics
Career & Jobs Infographics
Education Infographics
Entertainment Industry Infographics
Environmental Infographics
Finance & Money Infographics
Food & Drink Infographics
Health Infographics
Historical Infographics
Home & Garden Infographics
Internet Infographics
Law and Legal Infographics
Lifestyle Infographics
Marketing Infographics
Offbeat Infographics
Parenting Infographics
Pets & Animals Infographics
Political Infographics
Shopping Infographics
Sports and Athletic Infographics
Technology Infographics
Transportation Infographics
Travel Infographics
Video Infographics