Search 12,000+ Infographics!
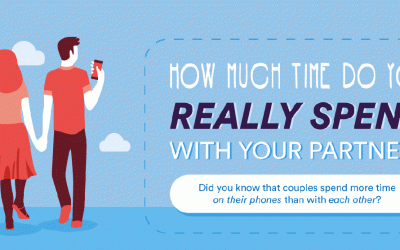
How Much Time Do You Really Spend With Your Partner?
This infographic from Mystery Vibe shows research on the amount of time couples spend together vs technology with the aim of encouraging couples to use technology instead to engage in intimacy, and take advantage of technology to improve their partnered well-being.
How To Become A Productive Student
Exam season is coming and that means students across the land will be panicking in the build-up to securing their diplomas and entering the great wild world of work. However, did you know that 80% of students have admitted to procrastinating for 3 hours a day, whether that be browsing the internet, using social media, watching TV or spending time with friends.
How Emotional Intelligence Helps Students
Success in the classroom depends on more than just your child’s IQ. The way your child identifies, understands, and manages emotions can have an impact on everything from his or her relationships with classmates to performance in the classroom. Because of this, emotional intelligence is an important stepping stone to success, both inside the classroom and beyond.
9 Facts About Artificial Intelligence
Artificial intelligence (AI) is getting lots of attention from press and investors. It’s a technology with the potential to transform many industries and many aspects of day to day life. Many companies think AI will influence all aspects of their business from products to services. Check out the following infographic to discover nine things you may not have known about AI.
Real Time Data Changing the Construction Industry
Real time data is becoming more important in the construction industry. Being one of the least digitized industries, the key to future success is collecting field data and utilizing it to make significant impact that won’t affect the bottom line. The following infographic demonstrates the importance of going digital and how this will benefit the construction industry in future.
Memory Malfunction: Cryptomnesia and Plagiarism
What do Helen Keller, Sam Smith and MLK Jr. have in common? They have all been accused of plagiarism. But was it actually plagiarism or perhaps a little-known phenomenon called Cryptomnesia? Cryptomnesia is the phenomenon of a forgotten memory being mistaken by the brain for a new and original thought. This infographic takes a close look at this odd occurrence: what it is, why it happens and who it’s happened to.
How To Turn Your Car Into an Eco-friendly Vehicle?
Over the years and after countless studies about the best solutions to take good care of our environment, car manufacturers have offered one of the best-suited keys to reduce vehicles’ hazardous impacts to the environment: hybrid and electric cars. While it is agreeable to be the best case, it is undeniably expensive and ultimately not for everyone. Here are some tips that you can consider turning your vehicle eco-friendly.
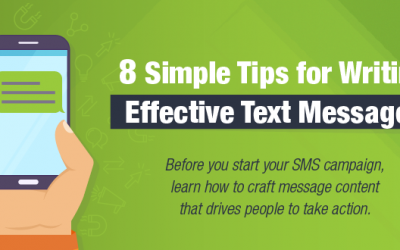
8 Simple Tips for Writing Effective Text Messages
Did you know 98% of text messages are opened and read within minutes? This certainly plays a huge role in why businesses are choosing text messaging to reach customers and employees. But there’s more to think about before you launch your next text message campaign. Here are 8 tips on writing effective text messages, courtesy of TextMarks.
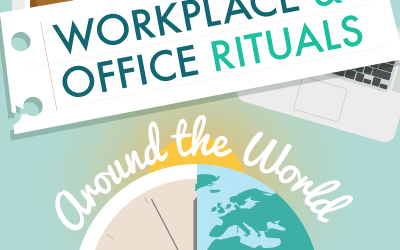
Workplace and Office Rituals From Around the World
Have you ever wondered what the working day is like in Japan? Or India? The team at WD Storage takes a trip round the world to see how office life varies from country to country. From morning commutes, to meetings to mealtimes, find out how workers in other countries spend their days.
Global Bubbles
So what causes financial bubbles? More recent theories on asset bubble formation suggest that they are likely sociologically driven events. While there is no clear agreement on what causes bubbles, there is evidence to suggest that they are not caused by bounded rationality or assumptions about the irrationality of others. This infographic explores a historical timeline of financial bubbles.
Partners
Browse Archives By Category
Animated Infographics
Business Infographics
Career & Jobs Infographics
Education Infographics
Entertainment Industry Infographics
Environmental Infographics
Finance & Money Infographics
Food & Drink Infographics
Health Infographics
Historical Infographics
Home & Garden Infographics
Internet Infographics
Law and Legal Infographics
Lifestyle Infographics
Marketing Infographics
Offbeat Infographics
Parenting Infographics
Pets & Animals Infographics
Political Infographics
Shopping Infographics
Sports and Athletic Infographics
Technology Infographics
Transportation Infographics
Travel Infographics
Video Infographics


