


Search 12,100+ Infographics!

12 Ways To Build Brand Advocates
Successful social media marketing is all about relationships, with the highest ROR (Return on Relationship) coming from relationships from people who are happy with your brand, and become your Brand Advocates. In this infographic, Info Graphic Design Team looks at 12 ways to build brand advocates.
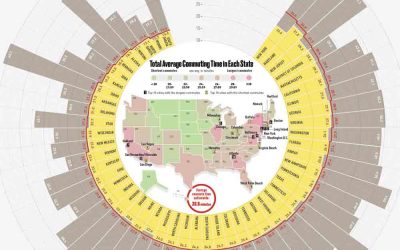
The Average Commute to Work by State and City
The national average commute time in the U.S. is 26.6 minutes, according to the Census Bureau. That means as a whole, the daily average American commute time is just under an hour, 53.2 minutes, assuming one round trip. Perhaps unsurprisingly, New York City has the longest average commute time. Los Angeles, which may experience ridiculous and irregular traffic jams, doesn’t even appear in the top ten. It doesn’t compare, apparently, to nearby Riverside-San Bernardino, CA, which comes in 8th.

The Right Time for a Social Media Post
Managing all of your social media networks can be a daunting task. Knowing the best times to post on social media is even more challenging. So, when are the best times to post on social media? Check out the following infographic to see their recommendations.

Cat Friendly Feline Safe Apartments
Cats are pretty self-sufficient critters, but they can still use a little help in staying safe — and you can probably use a little help in saving time and money on repairs. In this infographic, ForRent.com discusses some ideas on how to create a safe and cozy apartment for you and your tabby.
11 Facts About UK Mental Health and Mindfulness
It’s crucial people know as much about mental health as possible to hopefully erase the taboo and stigma that some people feel comes with having a mental health problem. The more people know about it then the more people will talk about it, thus helping to shatter the illusion that mental health isn’t a disease. The following infographic sheds some light on the current state of mental health within the UK and how Mindfulness can help.
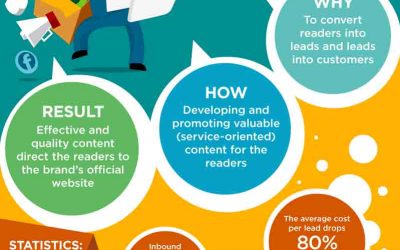
A Basic Guide To Make A Winning Inbound Marketing Strategy
In 2018, marketers are investing more in their inbound efforts, which tracks with the evolving nature of search engines, technology and the customer-centric world in which we now live. Check out this all-in-one guide on Inbound Marketing. Discover the winning inbound marketing strategy.

Budgeting for Your Window Replacement
Planning to replace your windows has many considerations when it comes to the benefit of your family and their safety as well. More than just giving an aesthetic look from the outside, windows can bring light and warmth, provide views, beautify inside and out and add tremendous value to your home. To learn how to budget for your window replacement, check out the following infographic courtesy of All County Exteriors.
23 Ways Hiking Makes You Healthier
Hiking is one of the best ways to improve your energy levels, sleep and overall quality of life. Since hikers and backpackers are physically active, they enjoy better health. And improved health and physical fitness are the basic factors which are required for maintaining a good and lifelong fitness. The following infographic from Riders Trail provides 23 ways that hiking makes you healthier.
Empower Your Employees
The more engaged and empowered your employees are, the more likely they are to feel a sense of ownership in your company. And naturally, they take more responsibility and create a more positive work environment for everyone involved. In this infographic, see how employees empowerment helps to boost your brand.
How To Trim and Shape Your Beard Fast and Easy
The most important first step to fashionably trimmed beard is patience. Make sure that you’ve given your beard enough time to grow out; typically one or two months. Some hairs will grow faster than others, so give your facial hair a chance to even out naturally. Learn how to trim and shape your beard fast and easy with this infographic by Beardoholic.
12 Ways To Build Brand Advocates
Successful social media marketing is all about relationships, with the highest ROR (Return on Relationship) coming from relationships from people who are happy with your brand, and become your Brand Advocates. In this infographic, Info Graphic Design Team looks at 12 ways to build brand advocates.
The Average Commute to Work by State and City
The national average commute time in the U.S. is 26.6 minutes, according to the Census Bureau. That means as a whole, the daily average American commute time is just under an hour, 53.2 minutes, assuming one round trip. Perhaps unsurprisingly, New York City has the longest average commute time. Los Angeles, which may experience ridiculous and irregular traffic jams, doesn’t even appear in the top ten. It doesn’t compare, apparently, to nearby Riverside-San Bernardino, CA, which comes in 8th.
The Right Time for a Social Media Post
Managing all of your social media networks can be a daunting task. Knowing the best times to post on social media is even more challenging. So, when are the best times to post on social media? Check out the following infographic to see their recommendations.
Cat Friendly Feline Safe Apartments
Cats are pretty self-sufficient critters, but they can still use a little help in staying safe — and you can probably use a little help in saving time and money on repairs. In this infographic, ForRent.com discusses some ideas on how to create a safe and cozy apartment for you and your tabby.
11 Facts About UK Mental Health and Mindfulness
It’s crucial people know as much about mental health as possible to hopefully erase the taboo and stigma that some people feel comes with having a mental health problem. The more people know about it then the more people will talk about it, thus helping to shatter the illusion that mental health isn’t a disease. The following infographic sheds some light on the current state of mental health within the UK and how Mindfulness can help.
A Basic Guide To Make A Winning Inbound Marketing Strategy
In 2018, marketers are investing more in their inbound efforts, which tracks with the evolving nature of search engines, technology and the customer-centric world in which we now live. Check out this all-in-one guide on Inbound Marketing. Discover the winning inbound marketing strategy.
Budgeting for Your Window Replacement
Planning to replace your windows has many considerations when it comes to the benefit of your family and their safety as well. More than just giving an aesthetic look from the outside, windows can bring light and warmth, provide views, beautify inside and out and add tremendous value to your home. To learn how to budget for your window replacement, check out the following infographic courtesy of All County Exteriors.
23 Ways Hiking Makes You Healthier
Hiking is one of the best ways to improve your energy levels, sleep and overall quality of life. Since hikers and backpackers are physically active, they enjoy better health. And improved health and physical fitness are the basic factors which are required for maintaining a good and lifelong fitness. The following infographic from Riders Trail provides 23 ways that hiking makes you healthier.
Empower Your Employees
The more engaged and empowered your employees are, the more likely they are to feel a sense of ownership in your company. And naturally, they take more responsibility and create a more positive work environment for everyone involved. In this infographic, see how employees empowerment helps to boost your brand.
How To Trim and Shape Your Beard Fast and Easy
The most important first step to fashionably trimmed beard is patience. Make sure that you’ve given your beard enough time to grow out; typically one or two months. Some hairs will grow faster than others, so give your facial hair a chance to even out naturally. Learn how to trim and shape your beard fast and easy with this infographic by Beardoholic.
Partners


Browse Archives By Category
Animated Infographics
Business Infographics
Career & Jobs Infographics
Education Infographics
Entertainment Industry Infographics
Environmental Infographics
Finance & Money Infographics
Food & Drink Infographics
Health Infographics
Historical Infographics
Home & Garden Infographics
Internet Infographics
Law and Legal Infographics
Lifestyle Infographics
Marketing Infographics
Offbeat Infographics
Parenting Infographics
Pets & Animals Infographics
Political Infographics
Shopping Infographics
Sports and Athletic Infographics
Technology Infographics
Transportation Infographics
Travel Infographics
Video Infographics