


Search 12,100+ Infographics!
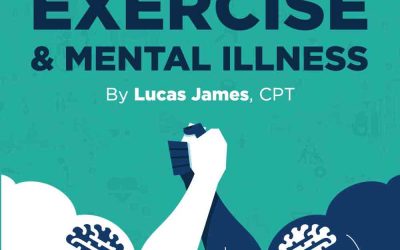
Exercise & Mental Illness
Regular exercise benefits the body physically, but did you know that exercise is one of the most powerful ways to improve mental illnesses? Mental health is our emotional, psychological, and social well-being, and can determine how we handle stress, relate to others, and make choices in our day-to-day lives. In the following infographic, celebrity fitness trainer, Lucas James, provides some evidence based research for the improvement of mental health.

Your Day VS Your Pets’ Day
Ever wondered what your pets are up to all day while you’re out at work? What are they thinking? What are they doing? Do they miss you? Well, wonder no more, because Vibrant Doors has the answers and have created the following infographic on the subject.

America’s Golden Age of Radio
During the 1930s, Americans’ main method of escape from war and poverty was radio. From thrilling mysteries to international news coverage, radio entertained and informed the American population like never before. In this infographic, Point Park University Online takes a visual look at the Golden Age of Radio.
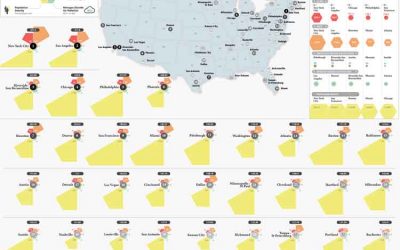
The Dirtiest Cities in the United States
What are the dirtiest cities in America? This infographic by bbcleaningservice.com combines data from the U.S. Environmental Protection Agency, the American Housing Survey, and the U.S. Census Bureau to create a metric used to determine which metropolitan areas are the dirtiest.
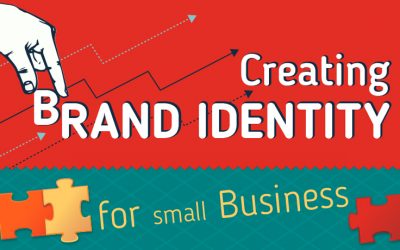
Creating Brand Identity for Small Business
When launching their products in the marketplace, new business owners are faced with many challenges. With the marketplace being more competitive than ever, new business owners need to find a way to target their audience and present their product in a way which will attract customers. Well established brand identity can be the key for finding a place in the sun.

Which Cat Breed is Best for My Apartment?
Cats make great pets for apartment dwellers. When compared to dogs, they’re typically less maintenance, are more self-sufficient, and require less training. However, all cat breeds are not created equal. There is of course a pet’s individual personality, but there are also overarching trends by the cat’s breed. The goal is to choose a cat breed that matches your lifestyle, personal preferences, and apartment.

How to Make a Good First Impression (Without Appearing Desperate)
Scientists squabble over the exact time it takes to make a first impression, but most agree we form lasting opinions within seconds of meeting someone. Whether it’s a barista, first date or potential business client, here’s an infographic that shows how to impress in that snap-moment without appearing too keen.

The Death Of Bitconnect
The controversial cryptocurrency exchange platform, Bitconnect, which has been flagged by several news sources as a ponzi scheme, has been taken down. Users are unable to cash in on the local BCC tokens, resulting in huge losses for investors. When cryptocurrency turns Ponzi scheme, people can lose everything. Learn more about the rise and fall of Bitconnect in this infographic.
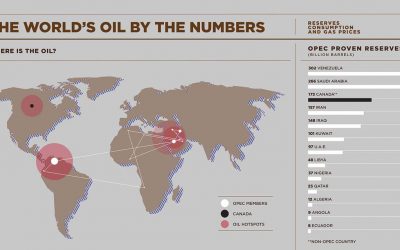
Are We in the Middle of an Oil Crisis?
The following infographic depicts the current state of oil in the world. We’re using a lot of it for many different things, and we can’t keep it up for much longer. This trend has moved many experts to say that we are in the midst of an oil crisis, one that we may not be able to recover from. Here are some of the ways the United States contributes to this downward spiral.
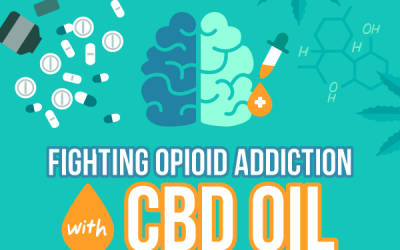
Fighting Opioid Addiction With CBD Oil
CBD Oil (otherwise known as cannabidiol) is scientifically proven to block the rewards of opioids and help with the fight against opioid addiction. Although CBD is primarily found in the resin glands of the fine hairs of cannabis’ female flower buds, CBD is non-psychoactive. This means that CBD oil offers the medicinal benefits of the cannabis plant in a controlled and precise way, without any of its party-drug effects or associations.
Exercise & Mental Illness
Regular exercise benefits the body physically, but did you know that exercise is one of the most powerful ways to improve mental illnesses? Mental health is our emotional, psychological, and social well-being, and can determine how we handle stress, relate to others, and make choices in our day-to-day lives. In the following infographic, celebrity fitness trainer, Lucas James, provides some evidence based research for the improvement of mental health.
Your Day VS Your Pets’ Day
Ever wondered what your pets are up to all day while you’re out at work? What are they thinking? What are they doing? Do they miss you? Well, wonder no more, because Vibrant Doors has the answers and have created the following infographic on the subject.
America’s Golden Age of Radio
During the 1930s, Americans’ main method of escape from war and poverty was radio. From thrilling mysteries to international news coverage, radio entertained and informed the American population like never before. In this infographic, Point Park University Online takes a visual look at the Golden Age of Radio.
The Dirtiest Cities in the United States
What are the dirtiest cities in America? This infographic by bbcleaningservice.com combines data from the U.S. Environmental Protection Agency, the American Housing Survey, and the U.S. Census Bureau to create a metric used to determine which metropolitan areas are the dirtiest.
Creating Brand Identity for Small Business
When launching their products in the marketplace, new business owners are faced with many challenges. With the marketplace being more competitive than ever, new business owners need to find a way to target their audience and present their product in a way which will attract customers. Well established brand identity can be the key for finding a place in the sun.
Which Cat Breed is Best for My Apartment?
Cats make great pets for apartment dwellers. When compared to dogs, they’re typically less maintenance, are more self-sufficient, and require less training. However, all cat breeds are not created equal. There is of course a pet’s individual personality, but there are also overarching trends by the cat’s breed. The goal is to choose a cat breed that matches your lifestyle, personal preferences, and apartment.
How to Make a Good First Impression (Without Appearing Desperate)
Scientists squabble over the exact time it takes to make a first impression, but most agree we form lasting opinions within seconds of meeting someone. Whether it’s a barista, first date or potential business client, here’s an infographic that shows how to impress in that snap-moment without appearing too keen.
The Death Of Bitconnect
The controversial cryptocurrency exchange platform, Bitconnect, which has been flagged by several news sources as a ponzi scheme, has been taken down. Users are unable to cash in on the local BCC tokens, resulting in huge losses for investors. When cryptocurrency turns Ponzi scheme, people can lose everything. Learn more about the rise and fall of Bitconnect in this infographic.
Are We in the Middle of an Oil Crisis?
The following infographic depicts the current state of oil in the world. We’re using a lot of it for many different things, and we can’t keep it up for much longer. This trend has moved many experts to say that we are in the midst of an oil crisis, one that we may not be able to recover from. Here are some of the ways the United States contributes to this downward spiral.
Fighting Opioid Addiction With CBD Oil
CBD Oil (otherwise known as cannabidiol) is scientifically proven to block the rewards of opioids and help with the fight against opioid addiction. Although CBD is primarily found in the resin glands of the fine hairs of cannabis’ female flower buds, CBD is non-psychoactive. This means that CBD oil offers the medicinal benefits of the cannabis plant in a controlled and precise way, without any of its party-drug effects or associations.
Partners


Browse Archives By Category
Animated Infographics
Business Infographics
Career & Jobs Infographics
Education Infographics
Entertainment Industry Infographics
Environmental Infographics
Finance & Money Infographics
Food & Drink Infographics
Health Infographics
Historical Infographics
Home & Garden Infographics
Internet Infographics
Law and Legal Infographics
Lifestyle Infographics
Marketing Infographics
Offbeat Infographics
Parenting Infographics
Pets & Animals Infographics
Political Infographics
Shopping Infographics
Sports and Athletic Infographics
Technology Infographics
Transportation Infographics
Travel Infographics
Video Infographics