


Search 12,100+ Infographics!
How Emotionally Intelligent Are You?
Emotional intelligence is one’s ability to perceive, understand and manage emotions. It is uses every day whether one hard at work in the office or dealing with a family member or friend in crisis. Good emotional intelligence improves relationships and an individual’s professional outlook. But how do you know if you’ve got it or not? The following infographic will help you figure out what kind of emotional intelligence you have.

How Money Impacts Our Romantic Relationships
Shepherds Friendly have carried out a survey and collaborated with Dr Becky Spelman to find out more the power that money can hold on our romantic relationships. Take a look at the interesting infographic below, you may learn a thing or two about why you or your partner might behave in a certain way, when dating or in a relationship.
Honey Who Shrunk My Chocolate Bars?
Remember when you were younger and Curly-Wurlies were the length of your arm? Or when a Wagon Wheel was the size of your face? Sadly, it turns out you were right. Chocolate bars really were bigger when you were a kid (and a lot cheaper). Take a look at Money Guru’s results and remember the glory days – when you really could use a Yorkie bar to wedge a door open.
How 34 Different Animals Survive Through the Winter
As you hustle through the bitter cold and dark to your car after a long day of work, do you ever wonder how animals survive in the winter? It is common knowledge that many species of birds migrate thousands of miles to warmer climates, but did you know that some butterflies and whales also embark on epic journeys to escape the freeze?
Who Bought What? – A Look at the Numbers for 2017
As one of the largest car finance brokers in Australia and a member of the car sales network, Stratton Finance has quite the well of information at their fingertips. And while taking a look back at the consumer purchase numbers for 2017, they found a few trends that you might find interesting. It is all compiled in the following infographic.

Healthy Baking Recipe Substitutions
From breakfast to dessert, it’s no secret that the folks at Greatist are huge fans of making the food we eat every day healthier. Here are some of their favorite baking recipe substitutions to help cut back on some of that unnecessary sugar and fat to make healthy, hearty, and delicious baked goods.

The Not So Good Cleaning Companies
Most cleaning companies are conscientious, hardworking and honest folks, but as occurs in many industries, there is always an exception to this fact. The following infographic explores the results of a survey of 100 establishments and reveals some not so good traits of some not so good cleaning companies.
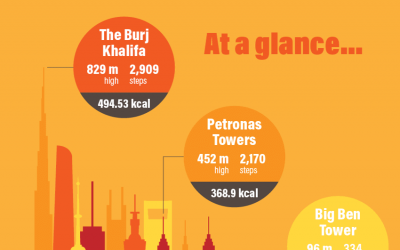
Calories Burned Climbing the World’s Tallest Buildings
A popular New Year’s resolution is to get fitter and healthier, so in the spirit of this, the folks at Shoe Zone decided to take a slightly different angle on things and find out how many calories you would burn if you climbed each of the world’s tallest buildings and landmarks. The results are slightly surprising, as you can see in the following infographic.

Keep Your Data Safe With Machine Learning
See how Microsoft uses advanced analytics—processing more than 450 billion authentications per month, scanning 400 billion emails for malware and phishing, and updating one billion devices—to deliver richer insights. These insights can help your organisation detect and respond to attacks quickly.
You Are What You Drink
Beer, Gin, Tequila…..What does your favorite drink say about your personality? Four Loko recently surveyed 2,000 drinkers about their favorite alcoholic beverage and from that data created ten profiles that reveal what people have in common based on their alcoholic beverage of choice.
How Emotionally Intelligent Are You?
Emotional intelligence is one’s ability to perceive, understand and manage emotions. It is uses every day whether one hard at work in the office or dealing with a family member or friend in crisis. Good emotional intelligence improves relationships and an individual’s professional outlook. But how do you know if you’ve got it or not? The following infographic will help you figure out what kind of emotional intelligence you have.
How Money Impacts Our Romantic Relationships
Shepherds Friendly have carried out a survey and collaborated with Dr Becky Spelman to find out more the power that money can hold on our romantic relationships. Take a look at the interesting infographic below, you may learn a thing or two about why you or your partner might behave in a certain way, when dating or in a relationship.
Honey Who Shrunk My Chocolate Bars?
Remember when you were younger and Curly-Wurlies were the length of your arm? Or when a Wagon Wheel was the size of your face? Sadly, it turns out you were right. Chocolate bars really were bigger when you were a kid (and a lot cheaper). Take a look at Money Guru’s results and remember the glory days – when you really could use a Yorkie bar to wedge a door open.
How 34 Different Animals Survive Through the Winter
As you hustle through the bitter cold and dark to your car after a long day of work, do you ever wonder how animals survive in the winter? It is common knowledge that many species of birds migrate thousands of miles to warmer climates, but did you know that some butterflies and whales also embark on epic journeys to escape the freeze?
Who Bought What? – A Look at the Numbers for 2017
As one of the largest car finance brokers in Australia and a member of the car sales network, Stratton Finance has quite the well of information at their fingertips. And while taking a look back at the consumer purchase numbers for 2017, they found a few trends that you might find interesting. It is all compiled in the following infographic.
Healthy Baking Recipe Substitutions
From breakfast to dessert, it’s no secret that the folks at Greatist are huge fans of making the food we eat every day healthier. Here are some of their favorite baking recipe substitutions to help cut back on some of that unnecessary sugar and fat to make healthy, hearty, and delicious baked goods.
The Not So Good Cleaning Companies
Most cleaning companies are conscientious, hardworking and honest folks, but as occurs in many industries, there is always an exception to this fact. The following infographic explores the results of a survey of 100 establishments and reveals some not so good traits of some not so good cleaning companies.
Calories Burned Climbing the World’s Tallest Buildings
A popular New Year’s resolution is to get fitter and healthier, so in the spirit of this, the folks at Shoe Zone decided to take a slightly different angle on things and find out how many calories you would burn if you climbed each of the world’s tallest buildings and landmarks. The results are slightly surprising, as you can see in the following infographic.
Keep Your Data Safe With Machine Learning
See how Microsoft uses advanced analytics—processing more than 450 billion authentications per month, scanning 400 billion emails for malware and phishing, and updating one billion devices—to deliver richer insights. These insights can help your organisation detect and respond to attacks quickly.
You Are What You Drink
Beer, Gin, Tequila…..What does your favorite drink say about your personality? Four Loko recently surveyed 2,000 drinkers about their favorite alcoholic beverage and from that data created ten profiles that reveal what people have in common based on their alcoholic beverage of choice.
Partners


Browse Archives By Category
Animated Infographics
Business Infographics
Career & Jobs Infographics
Education Infographics
Entertainment Industry Infographics
Environmental Infographics
Finance & Money Infographics
Food & Drink Infographics
Health Infographics
Historical Infographics
Home & Garden Infographics
Internet Infographics
Law and Legal Infographics
Lifestyle Infographics
Marketing Infographics
Offbeat Infographics
Parenting Infographics
Pets & Animals Infographics
Political Infographics
Shopping Infographics
Sports and Athletic Infographics
Technology Infographics
Transportation Infographics
Travel Infographics
Video Infographics