


Search 12,100+ Infographics!

Bad Practices You Thought Were Good For You
Back in the olden days, we were told that a lot of things were good for us, when they REALLY weren’t. Take a look at this infographic from Grey Haze that highlights products that were, at the time, supposed to help cure everything from coughs and colds to even cancer.
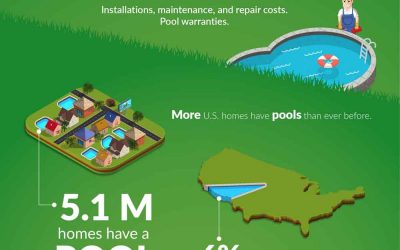
The Cost and Effectiveness of Pool Warranties
Having a pool is awesome and many choose to have one. But most of the times, people don’t fully understand how important it is to properly maintain it. Even proper maintenance cannot prevent major problems like a leaks, having problems with the filter and pump. That’s why, more and more people are choosing pool warranties to protect their investments.

The World’s Richest Pets
Some people love their pets so much, they treat them like their very own children, however most people would never think to leave their hard-earned cash to pets once they die. I said most as there are some that actually do leave their wealth to their beloved pets. Spending their life in luxury and comfort, meet some of the world’s richest pets, in an infographic.
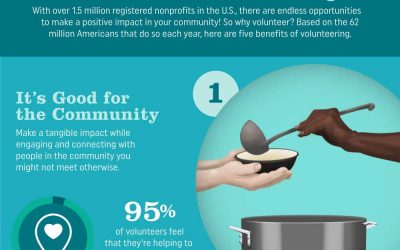
5 Benefits of Volunteering
Did you know that volunteering is scientifically proven to make you happier? Whether you volunteer in your community, with animals or in nature, there are many benefits that come with the act of volunteerism. Check the following infographic for a look into the top 5 benefits of volunteering.
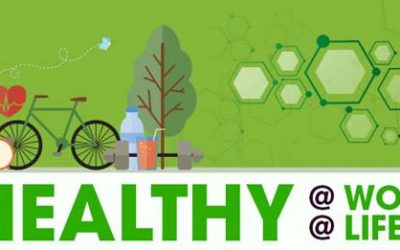
Healthy at Work, Healthy at Life
The more we embrace modern technologies and digital advancements in our lives, the more our health and well-being gets disturbed. The human body was never made to be seated for long hours at a stretch. But, it’s a great area of concern that almost all the white collar jobs demand continuous sitting in front of the computer. In fact, more than 80% of the office workers spend almost all their workday sitting at the desk.
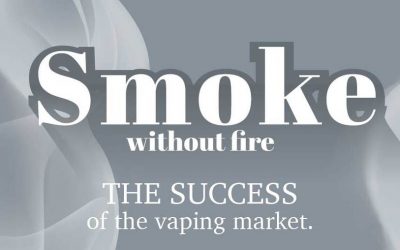
Smoke Without Fire
E-cigarettes, also known as vaping, is a growing market with the number of consumers increasing from 2.8 million in 2013 to 6.1 million in 2016. That’s a rise of 120%! in the folowing infographic, Grey Haze takes a look at some of the best things you didn’t know about vaping.

5 Tips for Turning Your Side Hustle Into a Business
These days, more and more people are working side jobs for extra income or simply because it is something they love to do outside of their full time gig. Do you have a side hustle or passion you wish you could turn into a career? This infographic outlines 5 tips to help turn your side hustle into a business.

Royal Residencies
It is a common saying that a persons’ home is their castle. Well in this case, they really are! Here is an infographic from Moneypod that features some of the best royal residencies in the UK, how you can visit them and what to look out for.

What To Do When it Rains in the Lake District
If you’re planning a trip to the Lakes, it’s best to be prepared for both rain and shine. Bear in mind that the Lake District wouldn’t have its majestic bodies of water if it wasn’t for frequent rainfall. So, let’s appreciate this weather phenomenon, get out there and experience everything the Lake District has on offer. Here is Craig Manor Hotel’s guide on what to do when you encounter a rainy day in the Lakes.

Do Me A Flavor!
The weird and wonderful world of things that shouldn’t taste good together, but do! Do you want to amaze your dinner party guests by creating some crazy concoctions that actually work? Then the folks at Grey Haze have the perfect graphic for you. In this piece, we’ve put together some starters, main courses, desserts and sides that you’ll have never heard, or dreamt of, before.
Bad Practices You Thought Were Good For You
Back in the olden days, we were told that a lot of things were good for us, when they REALLY weren’t. Take a look at this infographic from Grey Haze that highlights products that were, at the time, supposed to help cure everything from coughs and colds to even cancer.
The Cost and Effectiveness of Pool Warranties
Having a pool is awesome and many choose to have one. But most of the times, people don’t fully understand how important it is to properly maintain it. Even proper maintenance cannot prevent major problems like a leaks, having problems with the filter and pump. That’s why, more and more people are choosing pool warranties to protect their investments.
The World’s Richest Pets
Some people love their pets so much, they treat them like their very own children, however most people would never think to leave their hard-earned cash to pets once they die. I said most as there are some that actually do leave their wealth to their beloved pets. Spending their life in luxury and comfort, meet some of the world’s richest pets, in an infographic.
5 Benefits of Volunteering
Did you know that volunteering is scientifically proven to make you happier? Whether you volunteer in your community, with animals or in nature, there are many benefits that come with the act of volunteerism. Check the following infographic for a look into the top 5 benefits of volunteering.
Healthy at Work, Healthy at Life
The more we embrace modern technologies and digital advancements in our lives, the more our health and well-being gets disturbed. The human body was never made to be seated for long hours at a stretch. But, it’s a great area of concern that almost all the white collar jobs demand continuous sitting in front of the computer. In fact, more than 80% of the office workers spend almost all their workday sitting at the desk.
Smoke Without Fire
E-cigarettes, also known as vaping, is a growing market with the number of consumers increasing from 2.8 million in 2013 to 6.1 million in 2016. That’s a rise of 120%! in the folowing infographic, Grey Haze takes a look at some of the best things you didn’t know about vaping.
5 Tips for Turning Your Side Hustle Into a Business
These days, more and more people are working side jobs for extra income or simply because it is something they love to do outside of their full time gig. Do you have a side hustle or passion you wish you could turn into a career? This infographic outlines 5 tips to help turn your side hustle into a business.
Royal Residencies
It is a common saying that a persons’ home is their castle. Well in this case, they really are! Here is an infographic from Moneypod that features some of the best royal residencies in the UK, how you can visit them and what to look out for.
What To Do When it Rains in the Lake District
If you’re planning a trip to the Lakes, it’s best to be prepared for both rain and shine. Bear in mind that the Lake District wouldn’t have its majestic bodies of water if it wasn’t for frequent rainfall. So, let’s appreciate this weather phenomenon, get out there and experience everything the Lake District has on offer. Here is Craig Manor Hotel’s guide on what to do when you encounter a rainy day in the Lakes.
Do Me A Flavor!
The weird and wonderful world of things that shouldn’t taste good together, but do! Do you want to amaze your dinner party guests by creating some crazy concoctions that actually work? Then the folks at Grey Haze have the perfect graphic for you. In this piece, we’ve put together some starters, main courses, desserts and sides that you’ll have never heard, or dreamt of, before.
Partners


Browse Archives By Category
Animated Infographics
Business Infographics
Career & Jobs Infographics
Education Infographics
Entertainment Industry Infographics
Environmental Infographics
Finance & Money Infographics
Food & Drink Infographics
Health Infographics
Historical Infographics
Home & Garden Infographics
Internet Infographics
Law and Legal Infographics
Lifestyle Infographics
Marketing Infographics
Offbeat Infographics
Parenting Infographics
Pets & Animals Infographics
Political Infographics
Shopping Infographics
Sports and Athletic Infographics
Technology Infographics
Transportation Infographics
Travel Infographics
Video Infographics