


Search 12,100+ Infographics!
From Braids to Beehives: Ultimate Halloween Hairstyles
Halloween is a chance to strut your hairstyling skills with some bold styles that go beyond everyday looks. For example, although you would probably never wear a tall beehive to the office, an Elvira Halloween costume is a chance to experiment with dramatic height. Similarly, an old-fashioned Game Of Thrones style might be a bit much if you’re heading out to do errands. But paired with a cape, these curls and braids make for a stunning Halloween style.
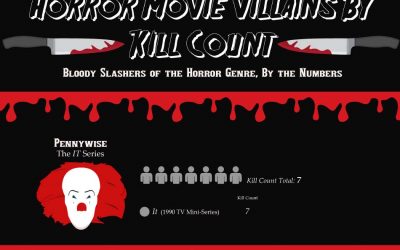
Horror Movie Villain Kill Count
There is no rhyme or reason why horror movies are so popular. But they always have been, and always will be. Probably it’s in human nature to seek for fear-made adrenalin. And when one can’t have it in a real life, they go and look for it in other places, books and movies in particular. This infographic is a collection of some of the most popular horror series, with the main villain and the number of poor victims.
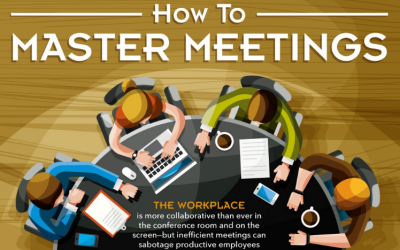
How To Master Meetings
There are a lot of problems with meetings today – for starters, they take up too much time. The workplace is more collaborative than ever in the conference room and on the screen but inefficient meetings can sabotage productive employees. Learn more about mastering meetings in this infographic from CBTS.
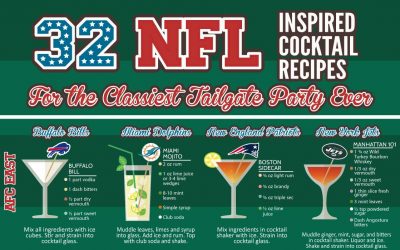
32 NFL Inspired Cocktail Recipes
The Tailgating Institute’s first ever research study analyzed the habits of over 20,000 tailgating individuals across 25 large American cities. They concluded that the standard tailgator is a college-educated 35-44 year old male. They spend on average of $500 annually on tailgating food and drinks, and begin the party 3-4 hours prior to kickoff! The following infographic created by PartsGeek.com is a collection of NFL-inspired cocktail recipes.
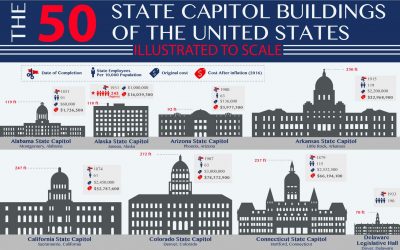
The 50 State Capitol Buildings of the U.S. Illustrated to Scale
This infographic presents all 50 US state capitol buildings as illustrated to scale, so you can easily compare the size of each capitol building to one another. It also explores when each building was built, its cost of construction (before and after inflation), and how many state employees there are in each state, per 10,000 population.
The Anatomy of a Professional Business Card
Picture this: You’re flying to a different city to visit some friends. You sit next to a friendly guy, and the two of you start talking. It turns out you’re from neighboring towns. He mentions he’s starting a new business venture and is looking for a consultant with your skill-set. How do you exchange contact information? You hand him a crisp, professional business card.
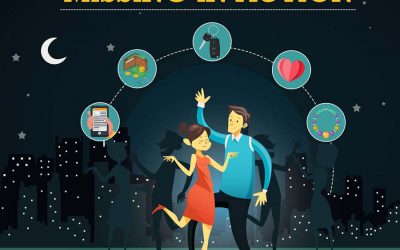
Missing in Action
It’s not surprising what goes missing on a Saturday night in a nightclub. The combination of dim lighting, mind altering substances, pick-pockets and a relatively large number of carefree people packed in a tight space means that things can go missing. Here is an infographic showing what goes missing on a Saturday night in a nightclub.
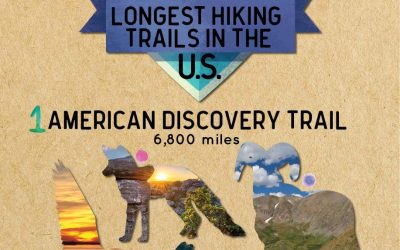
10 Longest Hiking Trails in the U.S.
With the following infographic, discover over 29,000 miles of North America’s natural treasures with the 10 longest continuous hiking trails in the United States. Explore mountains, beaches, forests, roads, and more as you hike from coast to coast. Challenge yourself mentally and physically while discovering new sights and sounds, and learn more about the world that thrives without human interference.

E-Commerce Web Design Trends for 2017
The emerging trend of e-commerce web design has been analyzed and predicted by many web design communities. But the question is, which e-commerce design trend is going to rule in 2017? Here are the things to watch out for in 2017.
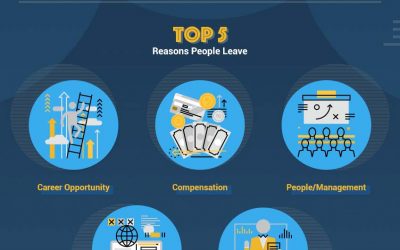
What Makes Employees Quit
People leave jobs for all sorts of reasons. It’s beneficial to form solid long-lasting teams that can grow and work together. In order to do that, it’s important to consider how to retain good talent by analyzing what causes employees to change jobs in the first place. The following infographic looks at why people leave their places of employment in detail.
From Braids to Beehives: Ultimate Halloween Hairstyles
Halloween is a chance to strut your hairstyling skills with some bold styles that go beyond everyday looks. For example, although you would probably never wear a tall beehive to the office, an Elvira Halloween costume is a chance to experiment with dramatic height. Similarly, an old-fashioned Game Of Thrones style might be a bit much if you’re heading out to do errands. But paired with a cape, these curls and braids make for a stunning Halloween style.
Horror Movie Villain Kill Count
There is no rhyme or reason why horror movies are so popular. But they always have been, and always will be. Probably it’s in human nature to seek for fear-made adrenalin. And when one can’t have it in a real life, they go and look for it in other places, books and movies in particular. This infographic is a collection of some of the most popular horror series, with the main villain and the number of poor victims.
How To Master Meetings
There are a lot of problems with meetings today – for starters, they take up too much time. The workplace is more collaborative than ever in the conference room and on the screen but inefficient meetings can sabotage productive employees. Learn more about mastering meetings in this infographic from CBTS.
32 NFL Inspired Cocktail Recipes
The Tailgating Institute’s first ever research study analyzed the habits of over 20,000 tailgating individuals across 25 large American cities. They concluded that the standard tailgator is a college-educated 35-44 year old male. They spend on average of $500 annually on tailgating food and drinks, and begin the party 3-4 hours prior to kickoff! The following infographic created by PartsGeek.com is a collection of NFL-inspired cocktail recipes.
The 50 State Capitol Buildings of the U.S. Illustrated to Scale
This infographic presents all 50 US state capitol buildings as illustrated to scale, so you can easily compare the size of each capitol building to one another. It also explores when each building was built, its cost of construction (before and after inflation), and how many state employees there are in each state, per 10,000 population.
The Anatomy of a Professional Business Card
Picture this: You’re flying to a different city to visit some friends. You sit next to a friendly guy, and the two of you start talking. It turns out you’re from neighboring towns. He mentions he’s starting a new business venture and is looking for a consultant with your skill-set. How do you exchange contact information? You hand him a crisp, professional business card.
Missing in Action
It’s not surprising what goes missing on a Saturday night in a nightclub. The combination of dim lighting, mind altering substances, pick-pockets and a relatively large number of carefree people packed in a tight space means that things can go missing. Here is an infographic showing what goes missing on a Saturday night in a nightclub.
10 Longest Hiking Trails in the U.S.
With the following infographic, discover over 29,000 miles of North America’s natural treasures with the 10 longest continuous hiking trails in the United States. Explore mountains, beaches, forests, roads, and more as you hike from coast to coast. Challenge yourself mentally and physically while discovering new sights and sounds, and learn more about the world that thrives without human interference.
E-Commerce Web Design Trends for 2017
The emerging trend of e-commerce web design has been analyzed and predicted by many web design communities. But the question is, which e-commerce design trend is going to rule in 2017? Here are the things to watch out for in 2017.
What Makes Employees Quit
People leave jobs for all sorts of reasons. It’s beneficial to form solid long-lasting teams that can grow and work together. In order to do that, it’s important to consider how to retain good talent by analyzing what causes employees to change jobs in the first place. The following infographic looks at why people leave their places of employment in detail.
Partners


Browse Archives By Category
Animated Infographics
Business Infographics
Career & Jobs Infographics
Education Infographics
Entertainment Industry Infographics
Environmental Infographics
Finance & Money Infographics
Food & Drink Infographics
Health Infographics
Historical Infographics
Home & Garden Infographics
Internet Infographics
Law and Legal Infographics
Lifestyle Infographics
Marketing Infographics
Offbeat Infographics
Parenting Infographics
Pets & Animals Infographics
Political Infographics
Shopping Infographics
Sports and Athletic Infographics
Technology Infographics
Transportation Infographics
Travel Infographics
Video Infographics