


Search 12,100+ Infographics!

Exploring Gift Trends and Preferences
A study carried out by The Gift Bot of a popular r/GiftIdeas subreddit, where people can request suggestions for a gift for anyone in their life. They reviewed almost 5,500 gift suggestions offered in over 930 unique threads, and aimed to answer our burning question: Which gift types are best received by which recipients?

14 Talent Retention Lessons From Highly Successful Companies
It’s no wonder that 93% of organizations are concerned about retaining employees, with one survey revealing that companies across the United States are prioritizing talent retention over revenue. How are some of the world’s largest companies keeping employees from leaving for new pastures? And how can businesses replicate their strategies.

Moving the White House
How many have considered what it must be like for the President of the United States to go through the tedious task of residential relocation like the rest of us? In the following infographic, Allied takes a look into just what a Presidential move at 1600 Pennsylvania Avenue looks like for both the outgoing and incoming Presidents, along with their families and staff members.

Allergy Symptoms, Types & Treatments
While allergies may cause mildly annoying and bothersome symptoms for people, some allergic reactions can be life-threatening. It’s important to know the difference and when to seek urgent care for allergies. Here is an infographic that contains information on allergy types, symptoms, treatments, and figures on how many people suffer from allergies.
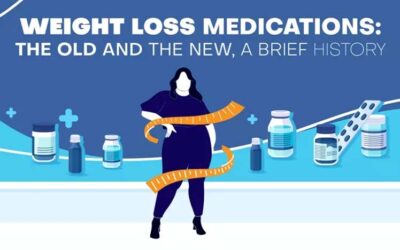
Weight Loss Medications: The Old and The New, A Brief History
With the latest craze over weight loss injectables, many have forgotten that weight loss medications have been around for years. Some have come and gone, while others have been around for a while. In the following infographic, look at what weight loss medications we have had over the years and how they have worked.
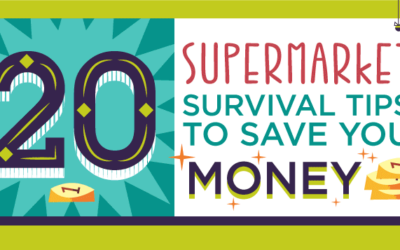
20 Supermarket Survival Tips To Save Money
Supermarkets and grocery stores provide convenience and offer a variety of goods. They are designed however to make us spend as much time and money as possible once we are inside. Fortunately, you can reduce your grocery bill without compromising on the quality of your food.

2024 Super Bowl MVP Odds
The 2024 Super Bowl MVP odds are live as the Kansas City Chiefs and San Francisco 49ers get ready to face off. The following infographic breaks down the Super Bowl MVP betting odds and provides analysis on the top contenders, sleepers, and final predictions.

Why Seek Residential Addiction Treatment?
Residential rehab is a type of addiction treatment that involves living in a facility for a period of time, typically 28 to 30 days, while receiving intensive therapy and support. It is often recommended for people with severe or long-term addictions, or for those who have co-occurring mental health disorders.

The Robot Revolution
There is a growing wave of transformation that is present across the economic landscape. Automation, which is being driven by developments in robotics and artificial intelligence, is altering sectors, reinventing the dynamics of the workforce, and posing important issues about our future. Here is an infographic that provides a data-driven examination of the worldwide reach and multifaceted ramifications of this phenomenon.
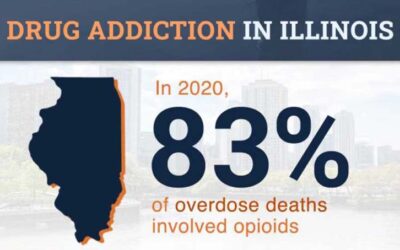
Drug Addiction Statistics In Illinois
Drug addiction is a major issue that affects millions of people in the United States, including those living in Illinois. According to the National Survey on Drug Use and Health, approximately 19.7 million Americans aged 12 and older struggled with a substance use disorder in 2017 alone. In an article combined with an infographic, Northern Illinois Recovery Drug Rehab Center discusses the prevalence of drug addiction in Illinois.
Exploring Gift Trends and Preferences
A study carried out by The Gift Bot of a popular r/GiftIdeas subreddit, where people can request suggestions for a gift for anyone in their life. They reviewed almost 5,500 gift suggestions offered in over 930 unique threads, and aimed to answer our burning question: Which gift types are best received by which recipients?
14 Talent Retention Lessons From Highly Successful Companies
It’s no wonder that 93% of organizations are concerned about retaining employees, with one survey revealing that companies across the United States are prioritizing talent retention over revenue. How are some of the world’s largest companies keeping employees from leaving for new pastures? And how can businesses replicate their strategies.
Moving the White House
How many have considered what it must be like for the President of the United States to go through the tedious task of residential relocation like the rest of us? In the following infographic, Allied takes a look into just what a Presidential move at 1600 Pennsylvania Avenue looks like for both the outgoing and incoming Presidents, along with their families and staff members.
Allergy Symptoms, Types & Treatments
While allergies may cause mildly annoying and bothersome symptoms for people, some allergic reactions can be life-threatening. It’s important to know the difference and when to seek urgent care for allergies. Here is an infographic that contains information on allergy types, symptoms, treatments, and figures on how many people suffer from allergies.
Weight Loss Medications: The Old and The New, A Brief History
With the latest craze over weight loss injectables, many have forgotten that weight loss medications have been around for years. Some have come and gone, while others have been around for a while. In the following infographic, look at what weight loss medications we have had over the years and how they have worked.
20 Supermarket Survival Tips To Save Money
Supermarkets and grocery stores provide convenience and offer a variety of goods. They are designed however to make us spend as much time and money as possible once we are inside. Fortunately, you can reduce your grocery bill without compromising on the quality of your food.
2024 Super Bowl MVP Odds
The 2024 Super Bowl MVP odds are live as the Kansas City Chiefs and San Francisco 49ers get ready to face off. The following infographic breaks down the Super Bowl MVP betting odds and provides analysis on the top contenders, sleepers, and final predictions.
Why Seek Residential Addiction Treatment?
Residential rehab is a type of addiction treatment that involves living in a facility for a period of time, typically 28 to 30 days, while receiving intensive therapy and support. It is often recommended for people with severe or long-term addictions, or for those who have co-occurring mental health disorders.
The Robot Revolution
There is a growing wave of transformation that is present across the economic landscape. Automation, which is being driven by developments in robotics and artificial intelligence, is altering sectors, reinventing the dynamics of the workforce, and posing important issues about our future. Here is an infographic that provides a data-driven examination of the worldwide reach and multifaceted ramifications of this phenomenon.
Drug Addiction Statistics In Illinois
Drug addiction is a major issue that affects millions of people in the United States, including those living in Illinois. According to the National Survey on Drug Use and Health, approximately 19.7 million Americans aged 12 and older struggled with a substance use disorder in 2017 alone. In an article combined with an infographic, Northern Illinois Recovery Drug Rehab Center discusses the prevalence of drug addiction in Illinois.
Partners


Browse Archives By Category
Animated Infographics
Business Infographics
Career & Jobs Infographics
Education Infographics
Entertainment Industry Infographics
Environmental Infographics
Finance & Money Infographics
Food & Drink Infographics
Health Infographics
Historical Infographics
Home & Garden Infographics
Internet Infographics
Law and Legal Infographics
Lifestyle Infographics
Marketing Infographics
Offbeat Infographics
Parenting Infographics
Pets & Animals Infographics
Political Infographics
Shopping Infographics
Sports and Athletic Infographics
Technology Infographics
Transportation Infographics
Travel Infographics
Video Infographics