


Search 12,100+ Infographics!
20 Tricks To Fall Asleep Fast
Lying awake all night and counting sheep? Don’t fall into the trap of relying on prescription medication as a sleeping aid. The next time you find it impossible to drift off, try one of these science-based tricks of falling asleep fast.

14 Best Movies Set in the Sunshine State
Here is a useful infographic that provides info about some of the coolest movies that were set in Florida. For each film you can learn what part of Florida it was set in, the year it was released and how it got on at the box office.
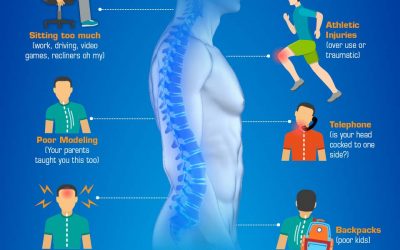
Your Posture is the Window to Your Spine and a Key to Your Health
A person’s posture can make them look more attractive, stronger and smarter. But your posture is also linked to health and mortality. Rolling forward of the shoulders and middle back creating a dowager’s hump is a predictor of mortality. Uneven shoulders and hips relate to a person’s loss of energy and proclivity towards a sedentary lifestyle and spine pain. In a world of smart phone over-use, gaming, longer commutes, heavy backpacks and prolonged time sitting; our posture suffers.

Make Better Business Decisions – Perform a Detailed Financial Forecast
For a business to develop an effective business plan, a detailed and well-though financial forecast should be made first. Like a map, a financial forecast should be able to help you make informed business decisions and overcome obstacles that may hinder your business growth in the future.
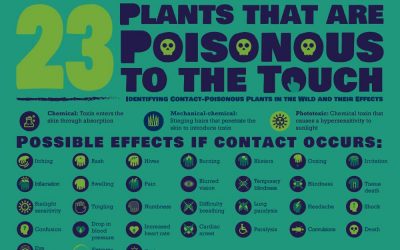
23 Plants That Are Poisonous To The Touch
It might seem like common knowledge, but if you can’t identify it in the wild, stay away from the berries and avoid eating the plants! Some will cause severe allergic skin reactions that need to be taken very seriously. This infographic from McDermatology.com features 23 plants that are poisonous to the touch.

10 Social Media Marketing Strategies for Companies
Social media is a vital place where brands can have fun and a measurable impact on the bottom line of each business. For this reason, social media can no longer live in a silo and must work in tandem with the whole business strategy. The Team at Social Media Magazine, published this infographic on social media marketing strategies so that you can become serious with getting customers through social media.
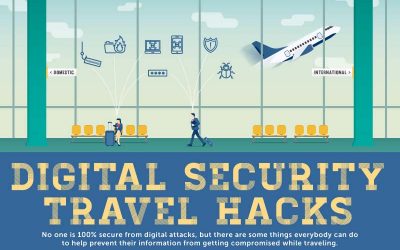
Digital Security Travel Hacks
It is impossible to be 100% secure from digital attacks on our personal information when traveling abroad because of a lack of secure internet connection. Because of this, Envista forensics visualized a guide on digital security hacks for travelers. In this guide they list the top 10 countries worst hit by hackers and identify theft.
Tourist Complaints That Will Leave You Speechless
The team at MyOffers searched the Internet to discover some of the most outrageous complaints from tourists. From travelers who were unhappy to discover that there were fish in the ocean to the tourists who have been unable to embrace the culture of a new country, complaining that the street signs were in a foreign language and even some that were outraged that shops would close during their ‘siesta’ period, you’ll find them compiled here in this visual asset.

How Many Calories You Burn Doing Housework
Most folks do not enjoy housework but if you think of it in terms of exercise, your opinion of performing household chores might change. Here is an infographic that provides information about the number of calories you can burn doing various household tasks.

The Benefits Of Automated Software Testing
All too often, when an application is released to market, it still has flaws. Test engineers often try their best to identify the bugs manually before the release of the product, but somehow, bugs creep in and even reappear after rigorous manual testing. To maximize efficiency and limit such problems, employing automation testing can be a great solution.
20 Tricks To Fall Asleep Fast
Lying awake all night and counting sheep? Don’t fall into the trap of relying on prescription medication as a sleeping aid. The next time you find it impossible to drift off, try one of these science-based tricks of falling asleep fast.
14 Best Movies Set in the Sunshine State
Here is a useful infographic that provides info about some of the coolest movies that were set in Florida. For each film you can learn what part of Florida it was set in, the year it was released and how it got on at the box office.
Your Posture is the Window to Your Spine and a Key to Your Health
A person’s posture can make them look more attractive, stronger and smarter. But your posture is also linked to health and mortality. Rolling forward of the shoulders and middle back creating a dowager’s hump is a predictor of mortality. Uneven shoulders and hips relate to a person’s loss of energy and proclivity towards a sedentary lifestyle and spine pain. In a world of smart phone over-use, gaming, longer commutes, heavy backpacks and prolonged time sitting; our posture suffers.
Make Better Business Decisions – Perform a Detailed Financial Forecast
For a business to develop an effective business plan, a detailed and well-though financial forecast should be made first. Like a map, a financial forecast should be able to help you make informed business decisions and overcome obstacles that may hinder your business growth in the future.
23 Plants That Are Poisonous To The Touch
It might seem like common knowledge, but if you can’t identify it in the wild, stay away from the berries and avoid eating the plants! Some will cause severe allergic skin reactions that need to be taken very seriously. This infographic from McDermatology.com features 23 plants that are poisonous to the touch.
10 Social Media Marketing Strategies for Companies
Social media is a vital place where brands can have fun and a measurable impact on the bottom line of each business. For this reason, social media can no longer live in a silo and must work in tandem with the whole business strategy. The Team at Social Media Magazine, published this infographic on social media marketing strategies so that you can become serious with getting customers through social media.
Digital Security Travel Hacks
It is impossible to be 100% secure from digital attacks on our personal information when traveling abroad because of a lack of secure internet connection. Because of this, Envista forensics visualized a guide on digital security hacks for travelers. In this guide they list the top 10 countries worst hit by hackers and identify theft.
Tourist Complaints That Will Leave You Speechless
The team at MyOffers searched the Internet to discover some of the most outrageous complaints from tourists. From travelers who were unhappy to discover that there were fish in the ocean to the tourists who have been unable to embrace the culture of a new country, complaining that the street signs were in a foreign language and even some that were outraged that shops would close during their ‘siesta’ period, you’ll find them compiled here in this visual asset.
How Many Calories You Burn Doing Housework
Most folks do not enjoy housework but if you think of it in terms of exercise, your opinion of performing household chores might change. Here is an infographic that provides information about the number of calories you can burn doing various household tasks.
The Benefits Of Automated Software Testing
All too often, when an application is released to market, it still has flaws. Test engineers often try their best to identify the bugs manually before the release of the product, but somehow, bugs creep in and even reappear after rigorous manual testing. To maximize efficiency and limit such problems, employing automation testing can be a great solution.
Partners


Browse Archives By Category
Animated Infographics
Business Infographics
Career & Jobs Infographics
Education Infographics
Entertainment Industry Infographics
Environmental Infographics
Finance & Money Infographics
Food & Drink Infographics
Health Infographics
Historical Infographics
Home & Garden Infographics
Internet Infographics
Law and Legal Infographics
Lifestyle Infographics
Marketing Infographics
Offbeat Infographics
Parenting Infographics
Pets & Animals Infographics
Political Infographics
Shopping Infographics
Sports and Athletic Infographics
Technology Infographics
Transportation Infographics
Travel Infographics
Video Infographics