


Search 12,100+ Infographics!
The Benefits of Experiential Learning
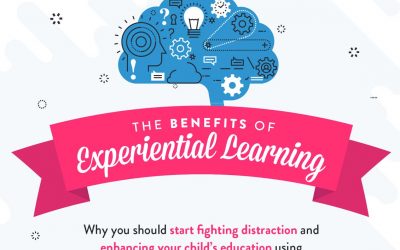
Experiential learning is the practice of learning through doing. It encourages the student to have first-hand experiences with the materials, rather than learning through someone else’s experiences in textbook or lecture. It’s a learning style that has been studied thoroughly for decades, and one that is proven to be beneficial for all ages of students.
The Working Dead: Is Sleep Deprivation Turning Your Employees Into Zombies?
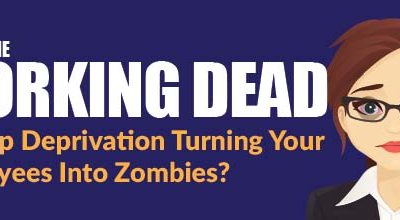
According to the Centers for Disease Control (CDC), over 81 million or ⅓ of American adults are chronically sleep deprived and this number is rising. The problem is so prevalent that the CDC has declared insufficient sleep a “public health epidemic”. In the following infographic, Optisom looks at how sleep deprivation may be turning your employees into zombies.

How To Spot Counterfeit Money: A Visual Guide
When counterfeit money gets into the circulation, it causes the value of real money to go down. This can also cause inflation! Here is an infographic that provides simple visual cues to help you figure out whether a suspect note or coin is indeed counterfeit.

Top Luxuries American’s Can’t Live Without
1,000 Americans were recently surveyed by Thermosoft to find out which modern day luxuries they could do without, and which they will never give up. The data and corresponding infographic provides an interesting look at the most common consumer goods Americans spend their disposable income on.
Parenting In a Digital Age
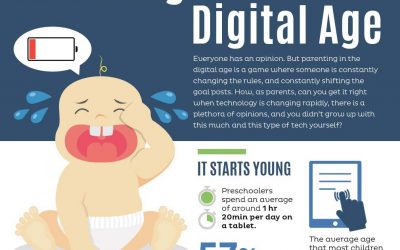
Here is an infographic courtesy of Sitters and designed to enlighten to the realities of parenting in the digital age. Our children’s habits have changed through the integrated and widely adopted use of technology.

Why Your Advanced Spam Filter Isn’t Enough
Advanced spam filters are a wonderful thing. Don’t get me wrong. But they aren’t enough to protect your organization from a phishing attack. If you’ve heard it once, then you’ve heard it a million times, it takes just one employee to click a malicious link or download an infected document to give your IT Support a headache or, much worse, cause a data breach.

How Much Sleep Does A Baby Need?
It seems sleep is what new-borns do the most, that and eat and.. well, you know!. But just how much sleep does a baby need? The following infographic from Merino Kids explains some baby sleep facts that you should know.
7 Causes of Cramps Before Periods
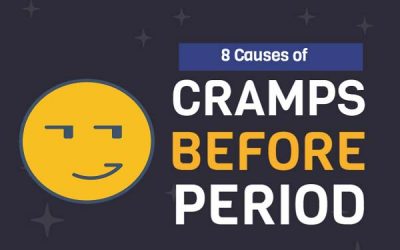
Cramps before period (pre period cramps) can be a blessing or a curse. It could be an early sign of pregnancy or other medical conditions like endometriosis or ectopic pregnancy. While cramps before period is common just before menstruation starts, there are other possible causes.
The following infographic explains the commonest causes you should know.

The Anatomy of a Car Crash in Phoenix, Arizona
With over 6,553,255 people living in the state of Arizona, there are bound to be several car accidents and fatalities on Arizona roads. The following infographic by Cluff Law Firm covers statistics, causes and other essential information about car accidents specific to the city of Phoenix, Arizona.
WTF World Toilet Facts
If you’ve ever traveled internationally, you’ve probably walked out of at least one foreign bathroom shaking your head and wondering “WTF?!”. If so, you’re not alone! Fast Cover Travel Insurance has created a hilarious new infographic has everything you never even knew you wanted to know about the weird and wonderful world of toilets!
The Benefits of Experiential Learning
Experiential learning is the practice of learning through doing. It encourages the student to have first-hand experiences with the materials, rather than learning through someone else’s experiences in textbook or lecture. It’s a learning style that has been studied thoroughly for decades, and one that is proven to be beneficial for all ages of students.
The Working Dead: Is Sleep Deprivation Turning Your Employees Into Zombies?
According to the Centers for Disease Control (CDC), over 81 million or ⅓ of American adults are chronically sleep deprived and this number is rising. The problem is so prevalent that the CDC has declared insufficient sleep a “public health epidemic”. In the following infographic, Optisom looks at how sleep deprivation may be turning your employees into zombies.
How To Spot Counterfeit Money: A Visual Guide
When counterfeit money gets into the circulation, it causes the value of real money to go down. This can also cause inflation! Here is an infographic that provides simple visual cues to help you figure out whether a suspect note or coin is indeed counterfeit.
Top Luxuries American’s Can’t Live Without
1,000 Americans were recently surveyed by Thermosoft to find out which modern day luxuries they could do without, and which they will never give up. The data and corresponding infographic provides an interesting look at the most common consumer goods Americans spend their disposable income on.
Parenting In a Digital Age
Here is an infographic courtesy of Sitters and designed to enlighten to the realities of parenting in the digital age. Our children’s habits have changed through the integrated and widely adopted use of technology.
Why Your Advanced Spam Filter Isn’t Enough
Advanced spam filters are a wonderful thing. Don’t get me wrong. But they aren’t enough to protect your organization from a phishing attack. If you’ve heard it once, then you’ve heard it a million times, it takes just one employee to click a malicious link or download an infected document to give your IT Support a headache or, much worse, cause a data breach.
How Much Sleep Does A Baby Need?
It seems sleep is what new-borns do the most, that and eat and.. well, you know!. But just how much sleep does a baby need? The following infographic from Merino Kids explains some baby sleep facts that you should know.
7 Causes of Cramps Before Periods
Cramps before period (pre period cramps) can be a blessing or a curse. It could be an early sign of pregnancy or other medical conditions like endometriosis or ectopic pregnancy. While cramps before period is common just before menstruation starts, there are other possible causes.
The following infographic explains the commonest causes you should know.
The Anatomy of a Car Crash in Phoenix, Arizona
With over 6,553,255 people living in the state of Arizona, there are bound to be several car accidents and fatalities on Arizona roads. The following infographic by Cluff Law Firm covers statistics, causes and other essential information about car accidents specific to the city of Phoenix, Arizona.
WTF World Toilet Facts
If you’ve ever traveled internationally, you’ve probably walked out of at least one foreign bathroom shaking your head and wondering “WTF?!”. If so, you’re not alone! Fast Cover Travel Insurance has created a hilarious new infographic has everything you never even knew you wanted to know about the weird and wonderful world of toilets!
Partners


Browse Archives By Category
Animated Infographics
Business Infographics
Career & Jobs Infographics
Education Infographics
Entertainment Industry Infographics
Environmental Infographics
Finance & Money Infographics
Food & Drink Infographics
Health Infographics
Historical Infographics
Home & Garden Infographics
Internet Infographics
Law and Legal Infographics
Lifestyle Infographics
Marketing Infographics
Offbeat Infographics
Parenting Infographics
Pets & Animals Infographics
Political Infographics
Shopping Infographics
Sports and Athletic Infographics
Technology Infographics
Transportation Infographics
Travel Infographics
Video Infographics