


Search 12,100+ Infographics!
e-Commerce Brands With Highest Earnings and Biggest Losses Over the Past Year
E-commerce is a booming industry full of competition and the possibility for extreme gains and painful losses. The team at LLCAttorney shows just how devastating these losses can be with a chart showing the companies with the biggest gains and losses in 2025.
30 Statistics About Customer Churn
Customer churn is a figure calculated that shows how many customers don’t return to a business over time. Strong customer loyalty is an invaluable asset to businesses across industries. The team at Qualtrics helps us understand customer churn across its many facets, using a chart that displays 30 key statistics.

Which States Have Been the Fastest to Adopt AI in the Workplace?
Across the United States, the adoption of artificial intelligence is growing, but unevenly. The Ooma team presents a new map that clearly shows which states are leading in AI adoption in the workforce and which are lagging. The team’s research shows a rapidly changing but uneven AI adoption landscape.
The Most Expensive U.S. States to Own a Car
Car purchase and maintenance costs are rising, leaving many Americans wondering how to make ownership more affordable. The team at Grease Monkey shows us that location is a significant factor in car ownership expenses. The team examined 15 car-related expenses and mapped each state based on these costs.
Where in the U.S. Do Cars Experience the Most Damage?
Many factors can damage a car, leading to expensive repairs or even a total loss. The Grease Monkey researcher considered the most impactful factors that damage a car and used this to score every state. Their results show that cars in Texas see the most damage.
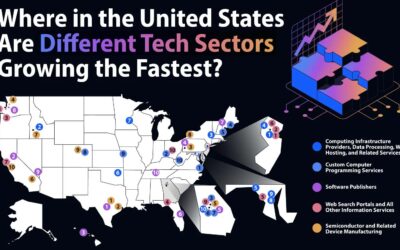
Where in the United States Are Different Tech Sectors Growing the Fastest?
Silicon Valley reigns supreme as the capital of technological progress, and with four of its companies valued in the trillions, its reputation won’t fade anytime soon. But a look at the broader technology landscape reveals that tech isn’t centered in the valley alone. Research from Pulse charts where different sectors of the tech industry are carving out their own space.

Where the Side-Gig Economy Is Growing the Fastest in the U.S.
A new study from LLC Attorney determined where in the U.S. the side-gig economy grew the most and presented evidence for why this micro-economy is booming. The team studied how many people in each state got a second job, as well as the number of non-employer businesses established in 2022 and 2023.

Boat Types Explained: From Kayaks to Super Yachts
The modern boating landscape extends far beyond the traditional “sail or power” divide. Today’s market spans everything from simple paddle-powered vessels to expansive, ocean-crossing yachts equipped with satellite internet, hybrid propulsion systems, and luxury accommodations. With such a wide range of options available, understanding the distinctions between boat types is essential to determining which is best suited to your needs.

Protect Your Home From Hidden Mold
Protecting your home from mold starts with understanding the conditions that allow it to grow and taking proactive steps to control moisture. Mold thrives in damp, humid environments and can develop quickly after leaks, flooding or poor ventilation.

Can You Guess the 1980s Musicians From Their Pins?
The 1980s introduced neon fashion, bold hairstyles, and music that defined an entire generation. Fans proudly displayed their loyalty by wearing buttons and pins featuring their favorite bands—a tradition that continues today through enamel pins celebrating the era’s iconic artists.
e-Commerce Brands With Highest Earnings and Biggest Losses Over the Past Year
E-commerce is a booming industry full of competition and the possibility for extreme gains and painful losses. The team at LLCAttorney shows just how devastating these losses can be with a chart showing the companies with the biggest gains and losses in 2025.
30 Statistics About Customer Churn
Customer churn is a figure calculated that shows how many customers don’t return to a business over time. Strong customer loyalty is an invaluable asset to businesses across industries. The team at Qualtrics helps us understand customer churn across its many facets, using a chart that displays 30 key statistics.
Which States Have Been the Fastest to Adopt AI in the Workplace?
Across the United States, the adoption of artificial intelligence is growing, but unevenly. The Ooma team presents a new map that clearly shows which states are leading in AI adoption in the workforce and which are lagging. The team’s research shows a rapidly changing but uneven AI adoption landscape.
The Most Expensive U.S. States to Own a Car
Car purchase and maintenance costs are rising, leaving many Americans wondering how to make ownership more affordable. The team at Grease Monkey shows us that location is a significant factor in car ownership expenses. The team examined 15 car-related expenses and mapped each state based on these costs.
Where in the U.S. Do Cars Experience the Most Damage?
Many factors can damage a car, leading to expensive repairs or even a total loss. The Grease Monkey researcher considered the most impactful factors that damage a car and used this to score every state. Their results show that cars in Texas see the most damage.
Where in the United States Are Different Tech Sectors Growing the Fastest?
Silicon Valley reigns supreme as the capital of technological progress, and with four of its companies valued in the trillions, its reputation won’t fade anytime soon. But a look at the broader technology landscape reveals that tech isn’t centered in the valley alone. Research from Pulse charts where different sectors of the tech industry are carving out their own space.
Where the Side-Gig Economy Is Growing the Fastest in the U.S.
A new study from LLC Attorney determined where in the U.S. the side-gig economy grew the most and presented evidence for why this micro-economy is booming. The team studied how many people in each state got a second job, as well as the number of non-employer businesses established in 2022 and 2023.
Boat Types Explained: From Kayaks to Super Yachts
The modern boating landscape extends far beyond the traditional “sail or power” divide. Today’s market spans everything from simple paddle-powered vessels to expansive, ocean-crossing yachts equipped with satellite internet, hybrid propulsion systems, and luxury accommodations. With such a wide range of options available, understanding the distinctions between boat types is essential to determining which is best suited to your needs.
Protect Your Home From Hidden Mold
Protecting your home from mold starts with understanding the conditions that allow it to grow and taking proactive steps to control moisture. Mold thrives in damp, humid environments and can develop quickly after leaks, flooding or poor ventilation.
Can You Guess the 1980s Musicians From Their Pins?
The 1980s introduced neon fashion, bold hairstyles, and music that defined an entire generation. Fans proudly displayed their loyalty by wearing buttons and pins featuring their favorite bands—a tradition that continues today through enamel pins celebrating the era’s iconic artists.
Partners


Browse Archives By Category
Animated Infographics
Business Infographics
Career & Jobs Infographics
Education Infographics
Entertainment Industry Infographics
Environmental Infographics
Finance & Money Infographics
Food & Drink Infographics
Health Infographics
Historical Infographics
Home & Garden Infographics
Internet Infographics
Law and Legal Infographics
Lifestyle Infographics
Marketing Infographics
Offbeat Infographics
Parenting Infographics
Pets & Animals Infographics
Political Infographics
Shopping Infographics
Sports and Athletic Infographics
Technology Infographics
Transportation Infographics
Travel Infographics
Video Infographics