


Search 12,100+ Infographics!
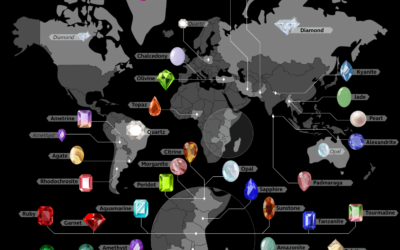
The Countries That Produce the Most of Each Type of Gemstone
Gemstones are found in countries all around the globe, although some parts of the world are much more abundant in these precious stones than others. Which countries have become the biggest sources of gemstones and diamonds? To answer this, the team at BriteCo created a world map that highlights the top-producing country for more than 30 different gemstones.

Countries Where Children Are the Most Satisfied With Their Lives
Many factors influence how happy, healthy, and successful children are and will grow up to be. Society plays a crucial role in these outcomes. This infographic visualizes comprehensive data from UNICEF on where children are the most satisfied with their lives, including statistics on mental well-being, suicide rates, physical health, obesity rates, academic achievement, social skills, family time, and more.

The Diversity of the Top 50 Fortune 500 CEOs Over Time
Corporate America is historically known for having a majority of white male CEOs, particularly Fortune 500 CEOs. While the corporate world still has a long way to go to be more inclusive, in recent years, the C-suite executives at many corporations have become much more diverse.

Fast Fashion Environmental Impact
Today’s fashion industry is synonymous with overconsumption, overproduction and widespread pollution. How bad is it right now? This infographic illustrates the environmental impact of the apparel industry, showcasing the statistics during the recent years.

Swimming Pool Maintenance Schedule and Tasks for Beginners
Optimize your pool’s condition effortlessly with this beginner friendly pool maintenance infographic. You’ll find a basic swimming pool maintenance schedule which lays out what you need to do for a clean pool, including when and how often to add chlorine, when to clean your pool, when to test and balance your pool water, and other routine maintenance items.

Top10 Purposes to Take Small Loans
According to a 1PLs Company (or 1Payday.Loans) study, up to 12 million Americans take out a payday loan each year. Why do people keep taking such cash advances? And most importantly, for what purpose do they take the money? This infographic compiles the top 10 main reasons why people are ready for big overpayments.

NFL Dynasties – Exploring the Best in History
Are the Kansas City Chiefs going to be the new dynasty In National Football League? GamblingSites.com has made a prediction based on the current Super Bowl stats. Explore the details in the following infographic.

Everything You Need to Know About Metal Barns
A barn is an agricultural building usually located on farms and used for various purposes. More often, they are used to house livestock, as well as equipment, fodder, and grain. Here is an infographic that provides everything you need to know about metal barns.

Top 10 Common AC Problems and DIY Tips
Summertime should be synonymous with comfort, yet too often, our trusty air conditioners decide to throw a curveball. Ever found yourself in a heated game of ‘Guess the AC Issue’? We’ve been there. In response, My Aire Heating and Cooling of Atlanta has distilled their expertise into the “Top 10 Common Air Conditioner Problems and DIY Tips Infographic”. Consider it your secret weapon against the capricious AC.

2023 Women’s World Cup Flags
Here is an infographic produced by UK Feather Flags that features all of the country flags from the 2023 Women’s world cup. The flags are displayed in the different groups of the tournament and there is also a fascinating fact for one of the flags in each of the groups.
The Countries That Produce the Most of Each Type of Gemstone
Gemstones are found in countries all around the globe, although some parts of the world are much more abundant in these precious stones than others. Which countries have become the biggest sources of gemstones and diamonds? To answer this, the team at BriteCo created a world map that highlights the top-producing country for more than 30 different gemstones.
Countries Where Children Are the Most Satisfied With Their Lives
Many factors influence how happy, healthy, and successful children are and will grow up to be. Society plays a crucial role in these outcomes. This infographic visualizes comprehensive data from UNICEF on where children are the most satisfied with their lives, including statistics on mental well-being, suicide rates, physical health, obesity rates, academic achievement, social skills, family time, and more.
The Diversity of the Top 50 Fortune 500 CEOs Over Time
Corporate America is historically known for having a majority of white male CEOs, particularly Fortune 500 CEOs. While the corporate world still has a long way to go to be more inclusive, in recent years, the C-suite executives at many corporations have become much more diverse.
Fast Fashion Environmental Impact
Today’s fashion industry is synonymous with overconsumption, overproduction and widespread pollution. How bad is it right now? This infographic illustrates the environmental impact of the apparel industry, showcasing the statistics during the recent years.
Swimming Pool Maintenance Schedule and Tasks for Beginners
Optimize your pool’s condition effortlessly with this beginner friendly pool maintenance infographic. You’ll find a basic swimming pool maintenance schedule which lays out what you need to do for a clean pool, including when and how often to add chlorine, when to clean your pool, when to test and balance your pool water, and other routine maintenance items.
Top10 Purposes to Take Small Loans
According to a 1PLs Company (or 1Payday.Loans) study, up to 12 million Americans take out a payday loan each year. Why do people keep taking such cash advances? And most importantly, for what purpose do they take the money? This infographic compiles the top 10 main reasons why people are ready for big overpayments.
NFL Dynasties – Exploring the Best in History
Are the Kansas City Chiefs going to be the new dynasty In National Football League? GamblingSites.com has made a prediction based on the current Super Bowl stats. Explore the details in the following infographic.
Everything You Need to Know About Metal Barns
A barn is an agricultural building usually located on farms and used for various purposes. More often, they are used to house livestock, as well as equipment, fodder, and grain. Here is an infographic that provides everything you need to know about metal barns.
Top 10 Common AC Problems and DIY Tips
Summertime should be synonymous with comfort, yet too often, our trusty air conditioners decide to throw a curveball. Ever found yourself in a heated game of ‘Guess the AC Issue’? We’ve been there. In response, My Aire Heating and Cooling of Atlanta has distilled their expertise into the “Top 10 Common Air Conditioner Problems and DIY Tips Infographic”. Consider it your secret weapon against the capricious AC.
2023 Women’s World Cup Flags
Here is an infographic produced by UK Feather Flags that features all of the country flags from the 2023 Women’s world cup. The flags are displayed in the different groups of the tournament and there is also a fascinating fact for one of the flags in each of the groups.
Partners


Browse Archives By Category
Animated Infographics
Business Infographics
Career & Jobs Infographics
Education Infographics
Entertainment Industry Infographics
Environmental Infographics
Finance & Money Infographics
Food & Drink Infographics
Health Infographics
Historical Infographics
Home & Garden Infographics
Internet Infographics
Law and Legal Infographics
Lifestyle Infographics
Marketing Infographics
Offbeat Infographics
Parenting Infographics
Pets & Animals Infographics
Political Infographics
Shopping Infographics
Sports and Athletic Infographics
Technology Infographics
Transportation Infographics
Travel Infographics
Video Infographics