


Search 12,100+ Infographics!

Gateway Courses are a Launchpad of Success
There are many ways to succeed in college. Learn more about how gateway courses can lead to a lifetime of higher education success for students and beyond in the visual deep dive below, courtesy of Kentucky Student Success Collaborative.

A Guide to Generative AI and Marketing
Just because generative AI has been grabbing all of the headlines doesn’t mean that you understand all of the useful tools at your fingertips. Learn more about how generative AI and marketing are changing the game in the infographic below, courtesy of Nova.
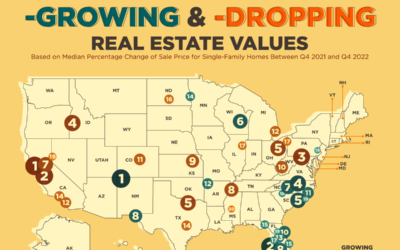
Cities With the Fastest Growing and Dropping Real Estate Values
The team at RealEstateAgents.com looked at data from the National Association of Realtors to see where home prices have increased and decreased the most in the past year. The study compares median home prices of single-family homes between the fourth quarter of 2021 and the fourth quarter of 2022 to determine where in the U.S. home prices are rising and falling the most.

The Most (and Least) Stressed Cities in the U.S.
If you’re feeling more stressed than ever before, you’re not alone. The research team at Charlotte’s Web wanted to know if certain American cities were experiencing higher levels of stress than others, so they conducted a study to determine the least and most stressed cities in America based on several stress-inducing factors.
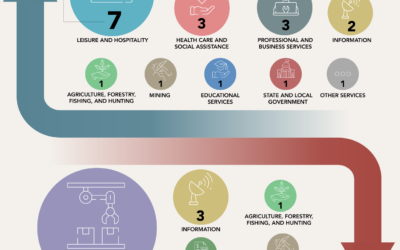
The Fastest Growing and Declining Industries in the United States
Which industries will thrive and which will flounder in a post-pandemic world with advancing artificial intelligence abilities? Using data from the Bureau of Labor Statistics, this infographic from U.S. Career Institute explores the 20 fastest-growing industries and 20 fastest-declining industries by employment numbers from 2021 to 2031.

Countries Ranked By Internet Privacy
With more people online than ever before and data breaches becoming more commonplace, governments have begun to address the issue with new laws to protect their citizens’ privacy on the Internet. Which countries have done the most to improve their citizens’ Internet and data privacy, and which countries leave their citizens vulnerable with barely any data protection in place?

Supporting Student Basic Needs
Did you know that many college students don’t have enough to eat and some are even homeless? It doesn’t have to be this way. Learn more about how organizations are more mindfully supporting student basic needs in the visual deep dive below, courtesy of the Kentucky Student Success Collaborative.

What is Network Detection and Response?
You’ve got to be on your A game when it comes to your cybersecurity chops to counteract today’s sophisticated attack vectors. Not to worry, network detection and response (NDR) is here to help. Learn more in the following infographic, courtesy of Live Action.

The Most Popular Sport in Every Country
How many kinds of sports are there? According to the World Sports Encyclopedia, there are more than 8,000 sports and sporting games! The most popular sport in the U.S. is football, but it is by far in the minority compared to the rest of the world. Here is the ultimate guide to the most popular sport in every country.

Why Louisville is a Great Place to Live
There’s more than the Kentucky Derby and bourbon to behold. Looking for a beautiful, clean, safe, and inexpensive place to move to? Learn more about why now is the time to invest in buying Louisville real estate in the following infographic, courtesy of Finish Line Realty.
Gateway Courses are a Launchpad of Success
There are many ways to succeed in college. Learn more about how gateway courses can lead to a lifetime of higher education success for students and beyond in the visual deep dive below, courtesy of Kentucky Student Success Collaborative.
A Guide to Generative AI and Marketing
Just because generative AI has been grabbing all of the headlines doesn’t mean that you understand all of the useful tools at your fingertips. Learn more about how generative AI and marketing are changing the game in the infographic below, courtesy of Nova.
Cities With the Fastest Growing and Dropping Real Estate Values
The team at RealEstateAgents.com looked at data from the National Association of Realtors to see where home prices have increased and decreased the most in the past year. The study compares median home prices of single-family homes between the fourth quarter of 2021 and the fourth quarter of 2022 to determine where in the U.S. home prices are rising and falling the most.
The Most (and Least) Stressed Cities in the U.S.
If you’re feeling more stressed than ever before, you’re not alone. The research team at Charlotte’s Web wanted to know if certain American cities were experiencing higher levels of stress than others, so they conducted a study to determine the least and most stressed cities in America based on several stress-inducing factors.
The Fastest Growing and Declining Industries in the United States
Which industries will thrive and which will flounder in a post-pandemic world with advancing artificial intelligence abilities? Using data from the Bureau of Labor Statistics, this infographic from U.S. Career Institute explores the 20 fastest-growing industries and 20 fastest-declining industries by employment numbers from 2021 to 2031.
Countries Ranked By Internet Privacy
With more people online than ever before and data breaches becoming more commonplace, governments have begun to address the issue with new laws to protect their citizens’ privacy on the Internet. Which countries have done the most to improve their citizens’ Internet and data privacy, and which countries leave their citizens vulnerable with barely any data protection in place?
Supporting Student Basic Needs
Did you know that many college students don’t have enough to eat and some are even homeless? It doesn’t have to be this way. Learn more about how organizations are more mindfully supporting student basic needs in the visual deep dive below, courtesy of the Kentucky Student Success Collaborative.
What is Network Detection and Response?
You’ve got to be on your A game when it comes to your cybersecurity chops to counteract today’s sophisticated attack vectors. Not to worry, network detection and response (NDR) is here to help. Learn more in the following infographic, courtesy of Live Action.
The Most Popular Sport in Every Country
How many kinds of sports are there? According to the World Sports Encyclopedia, there are more than 8,000 sports and sporting games! The most popular sport in the U.S. is football, but it is by far in the minority compared to the rest of the world. Here is the ultimate guide to the most popular sport in every country.
Why Louisville is a Great Place to Live
There’s more than the Kentucky Derby and bourbon to behold. Looking for a beautiful, clean, safe, and inexpensive place to move to? Learn more about why now is the time to invest in buying Louisville real estate in the following infographic, courtesy of Finish Line Realty.
Partners


Browse Archives By Category
Animated Infographics
Business Infographics
Career & Jobs Infographics
Education Infographics
Entertainment Industry Infographics
Environmental Infographics
Finance & Money Infographics
Food & Drink Infographics
Health Infographics
Historical Infographics
Home & Garden Infographics
Internet Infographics
Law and Legal Infographics
Lifestyle Infographics
Marketing Infographics
Offbeat Infographics
Parenting Infographics
Pets & Animals Infographics
Political Infographics
Shopping Infographics
Sports and Athletic Infographics
Technology Infographics
Transportation Infographics
Travel Infographics
Video Infographics